Quantitative Assessment of DESIS Hyperspectral Data for Plant Biodiversity Estimation in Australia
Publication
Metrics
AI Quick Summary
This study evaluates the DESIS hyperspectral data's efficacy in estimating plant species richness in southeast Australia's Southern Tablelands and Snowy Mountains. The best model achieved a correlation coefficient of 0.71 and RMSE of 5.99 in the Southern Tablelands, and 0.62 and RMSE of 6.20 in the Snowy Mountains, indicating potential for using hyperspectral data in biodiversity assessments.
Paper Preview
Abstract
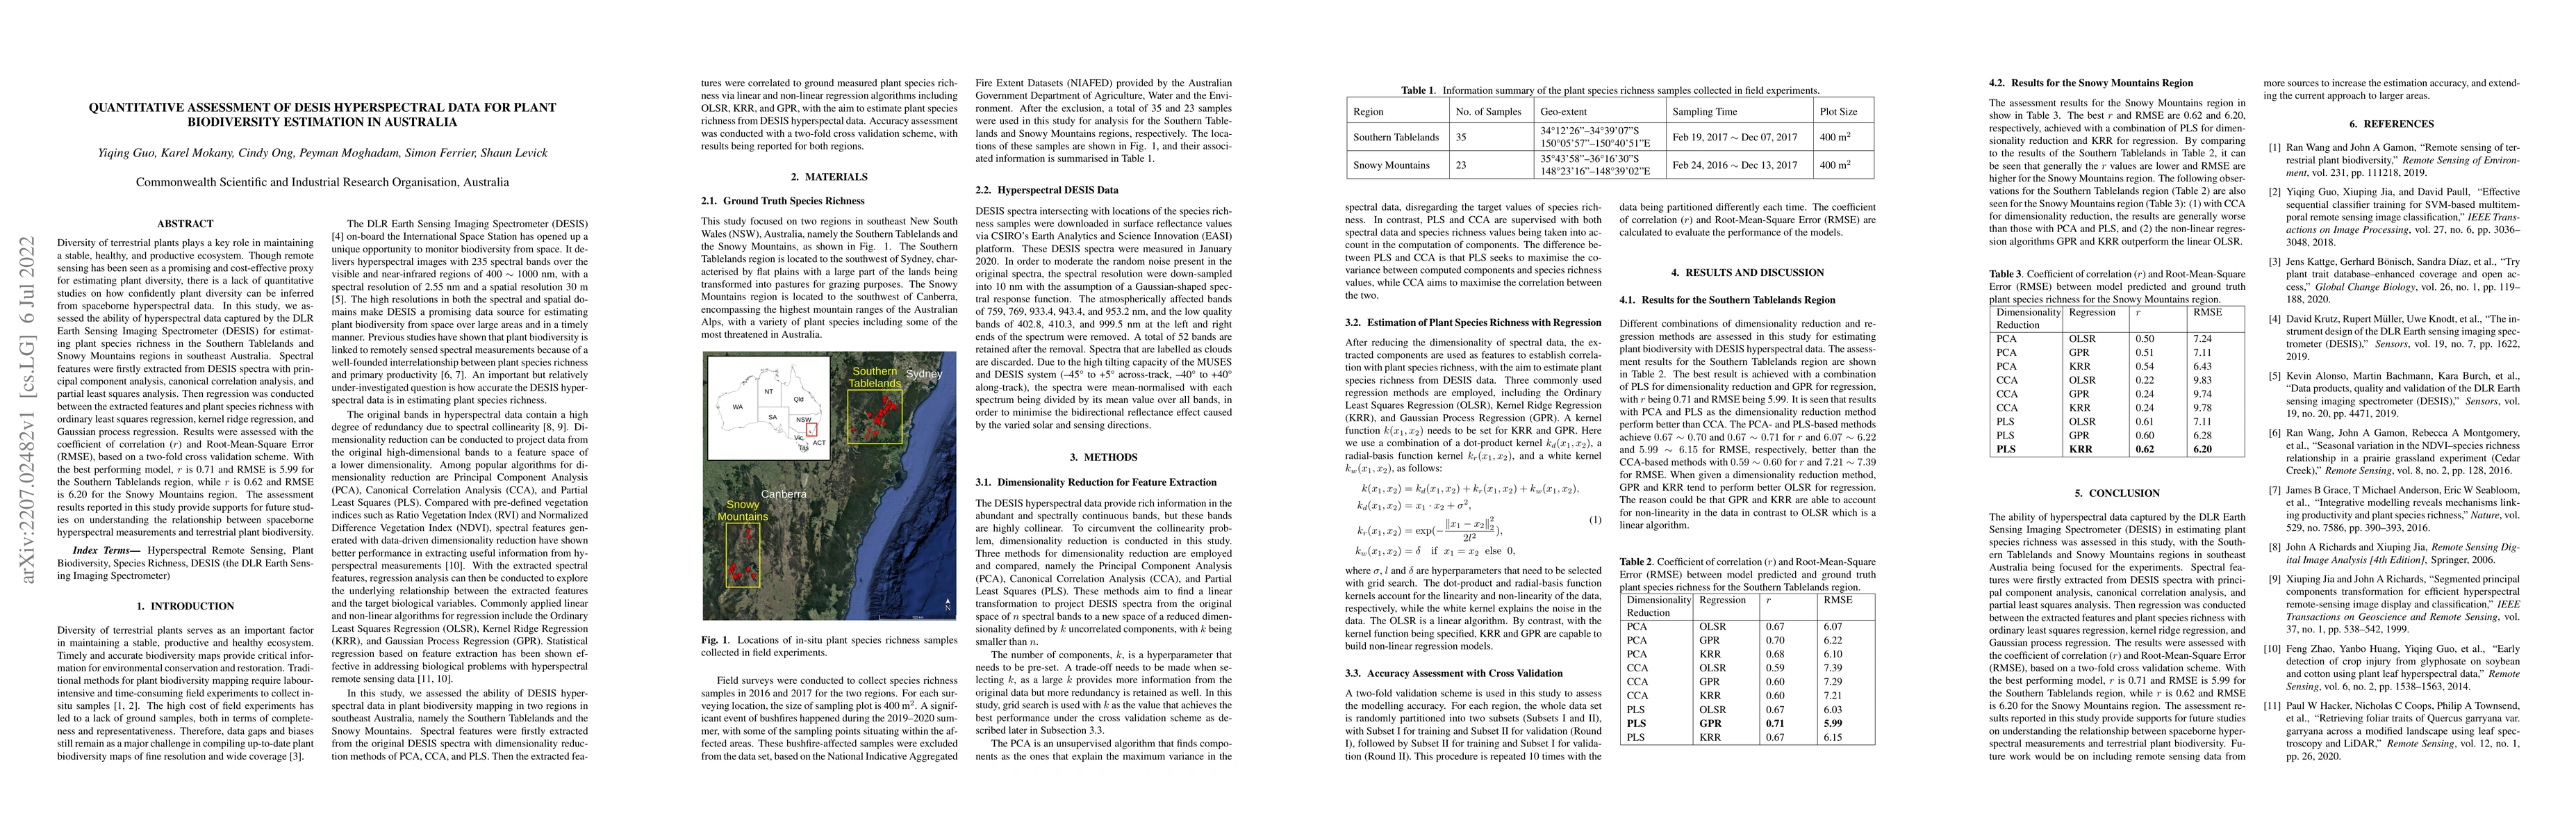
Diversity of terrestrial plants plays a key role in maintaining a stable, healthy, and productive ecosystem. Though remote sensing has been seen as a promising and cost-effective proxy for estimating plant diversity, there is a lack of quantitative studies on how confidently plant diversity can be inferred from spaceborne hyperspectral data. In this study, we assessed the ability of hyperspectral data captured by the DLR Earth Sensing Imaging Spectrometer (DESIS) for estimating plant species richness in the Southern Tablelands and Snowy Mountains regions in southeast Australia. Spectral features were firstly extracted from DESIS spectra with principal component analysis, canonical correlation analysis, and partial least squares analysis. Then regression was conducted between the extracted features and plant species richness with ordinary least squares regression, kernel ridge regression, and Gaussian process regression. Results were assessed with the coefficient of correlation ($r$) and Root-Mean-Square Error (RMSE), based on a two-fold cross validation scheme. With the best performing model, $r$ is 0.71 and RMSE is 5.99 for the Southern Tablelands region, while $r$ is 0.62 and RMSE is 6.20 for the Snowy Mountains region. The assessment results reported in this study provide supports for future studies on understanding the relationship between spaceborne hyperspectral measurements and terrestrial plant biodiversity.
AI Key Findings
Get AI-generated insights about this paper's methodology, results, significance, and more — seven facets brought into focus.
Impact
Paper Details
Authors
PDF Preview
Key Terms
Citation Network
Current paper (gray), citations (green), references (blue)
Display is limited for performance on very large graphs.
Discussion 0