Quantitative Stirling Cycle Measurements: P-V Diagram and Refrigeration
Publication
Metrics
Paper Preview
Abstract
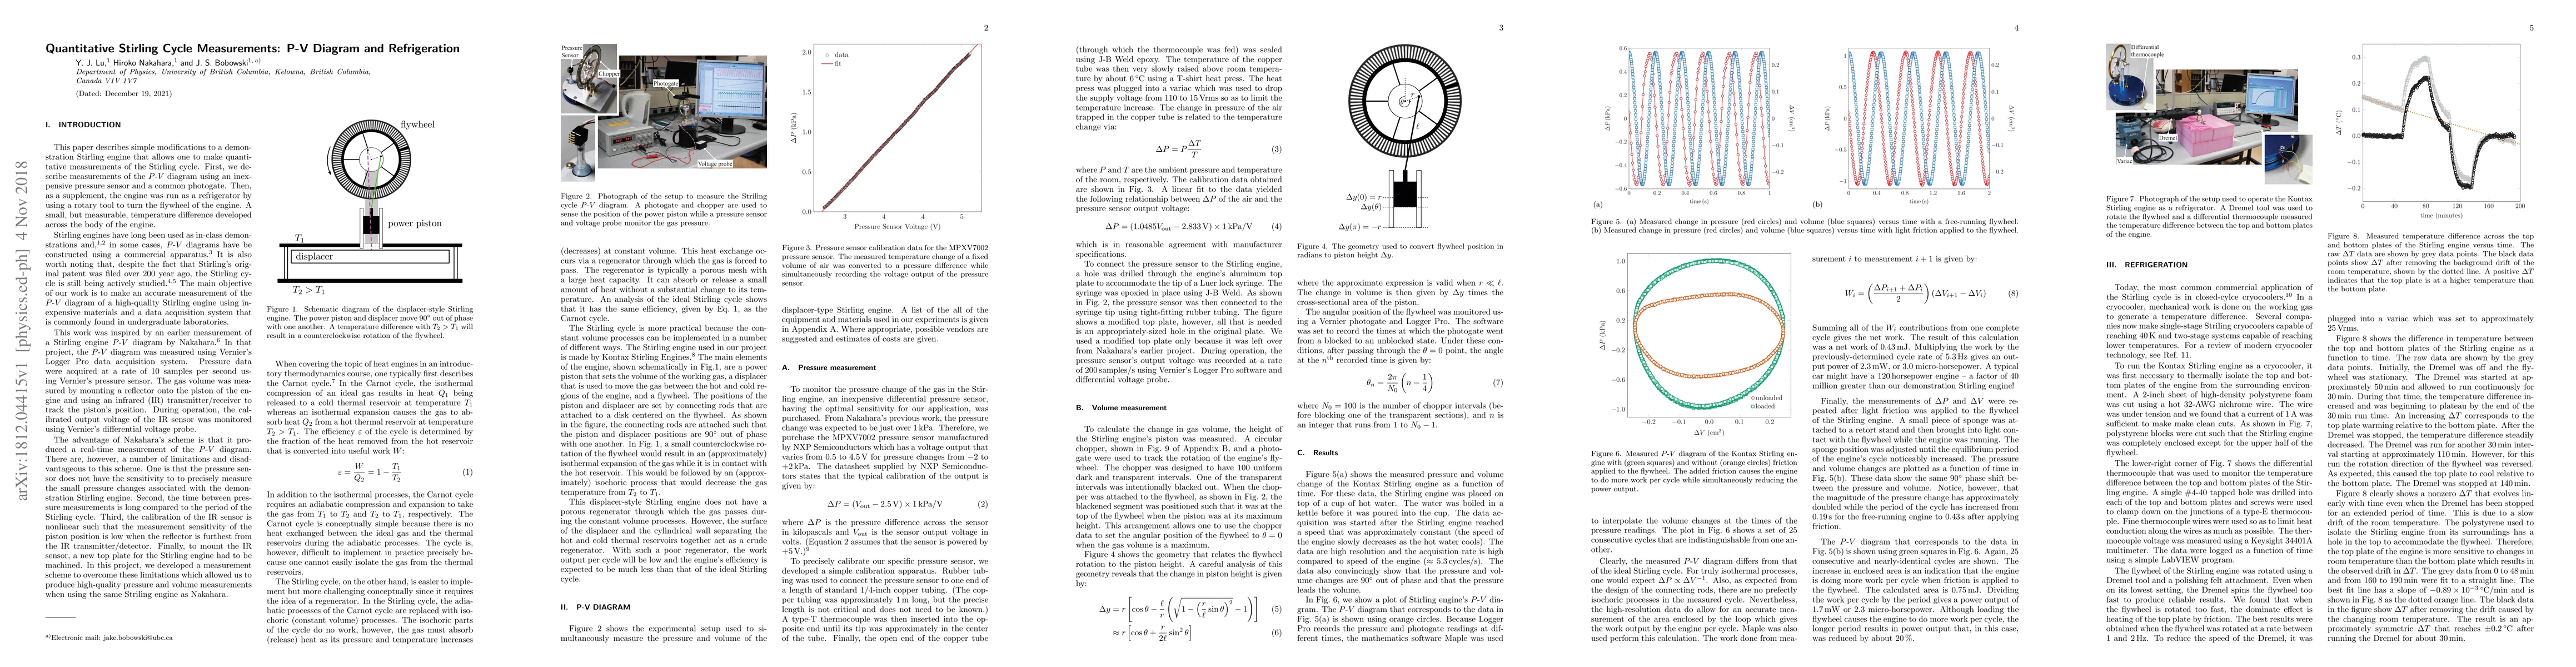
This paper describes simple modifications to a demonstration Stirling engine that allows one to make quantitative measurements of the Stirling cycle. First, we describe measurements of the $P$-$V$ diagram using an inexpensive pressure sensor and a common photogate. Then, as a supplement, the engine was run as a refrigerator by using a rotary tool to turn the flywheel of the engine. A small, but measurable, temperature difference developed across the body of the engine.
AI Key Findings
Get AI-generated insights about this paper's methodology, results, significance, and more — seven facets brought into focus.
Impact
Paper Details
Authors
PDF Preview
Key Terms
Citation Network
Current paper (gray), citations (green), references (blue)
Display is limited for performance on very large graphs.
Discussion 0