Authors
Summary
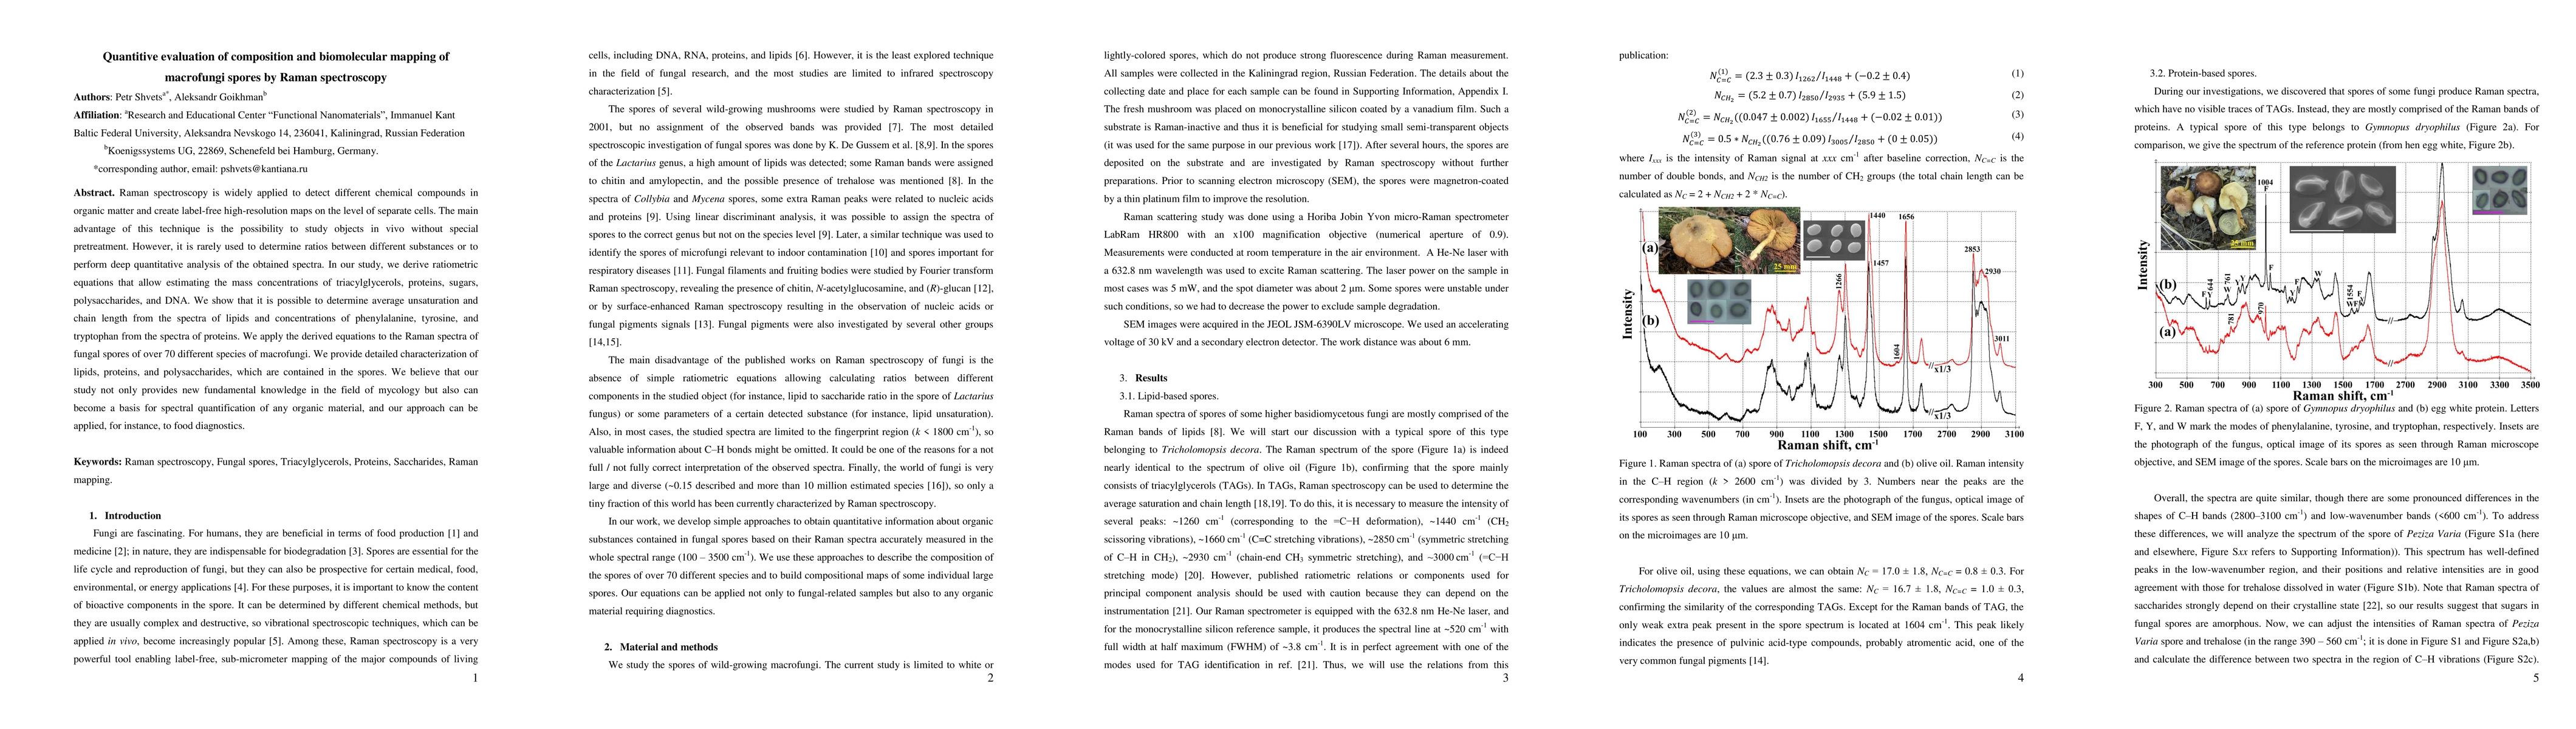
Raman spectroscopy is widely applied to detect different chemical compounds in organic matter and create label-free high-resolution maps on the level of separate cells. The main advantage of this technique is the possibility to study objects in vivo without special pretreatment. However, it is rarely used to determine ratios between different substances or to perform deep quantitative analysis of the obtained spectra. In our study, we derive ratiometric equations that allow estimating the mass concentrations of triacylglycerols, proteins, sugars, polysaccharides, and DNA. We show that it is possible to determine average unsaturation and chain length from the spectra of lipids and concentrations of phenylalanine, tyrosine, and tryptophan from the spectra of proteins. We apply the derived equations to the Raman spectra of fungal spores of over 70 different species of macrofungi. We provide detailed characterization of lipids, proteins, and polysaccharides, which are contained in the spores. We believe that our study not only provides new fundamental knowledge in the field of mycology but also can become a basis for spectral quantification of any organic material, and our approach can be applied, for instance, to food diagnostics.
AI Key Findings
Get AI-generated insights about this paper's methodology, results, and significance.
Paper Details
PDF Preview
Citation Network
Current paper (gray), citations (green), references (blue)
Display is limited for performance on very large graphs.
Similar Papers
Found 4 papersCombination of Raman spectroscopy and chemometrics: A review of recent studies published in the Spectrochimica Acta, Part A: Molecular and Biomolecular Spectroscopy Journal
Yulia Khristoforova, Lyudmila Bratchenko, Ivan Bratchenko
A review of artificial intelligence methods combined with Raman spectroscopy to identify the composition of substances
Peng Zhang, Liangrui Pan, Mitchai Chongcheawchamnan et al.
Tip-Enhanced Raman Spectroscopy of Cell Wall Heterogeneity for Aspergillus Fumigatus
Peng Zhang, Zhe He, Zhenfei Jiang et al.
No citations found for this paper.
Comments (0)