Publication
Metrics
AI Quick Summary
This research investigates whether the quasar main sequence is best represented as a linear plane or a more complex structure. The study confirms the presence of two dominant Eigenvectors in high-quality quasar samples and finds that a non-linear approach better captures the variance, defining a new plane where black hole mass likely represents the main axis and luminosity the secondary axis.
Paper Preview
Abstract
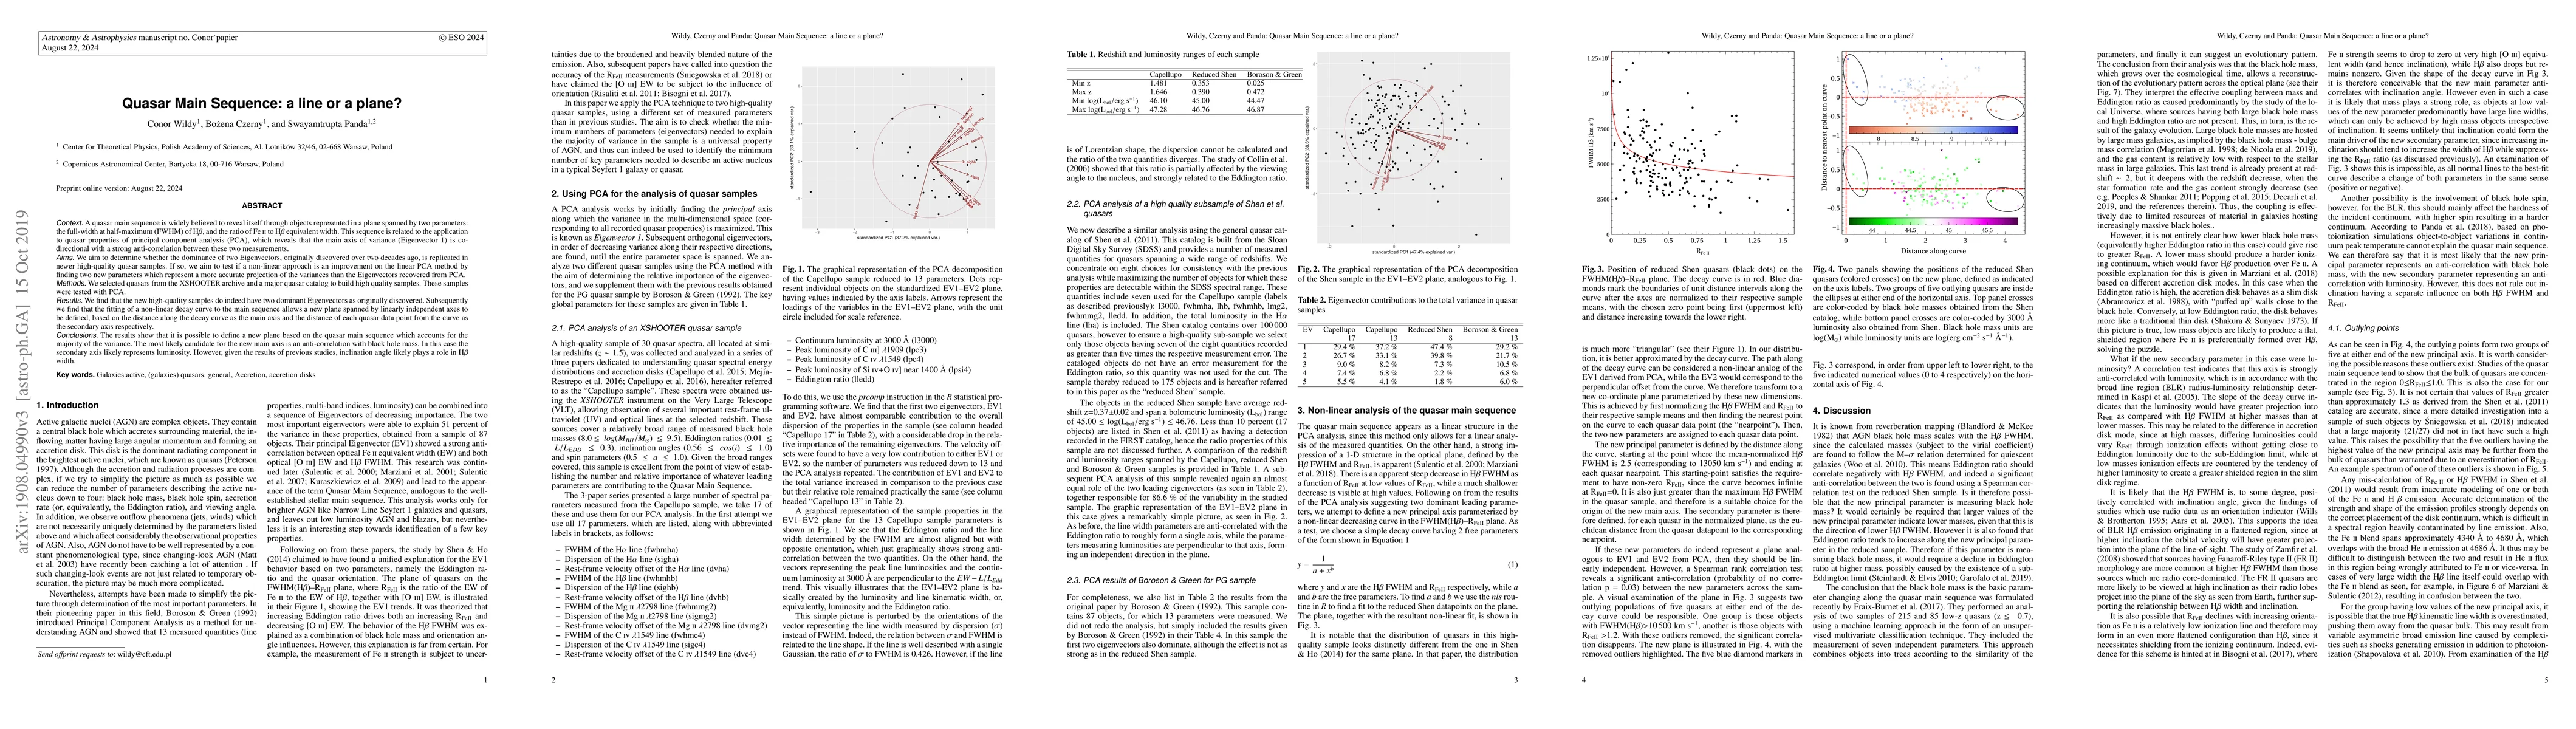
A quasar main sequence is widely believed to reveal itself through objects represented in a plane spanned by two parameters: the full-width at half-maximum (FWHM) of H$\beta{}$, and the ratio of Fe II to H$\beta{}$ equivalent width. This sequence is related to the application to quasar properties of principal component analysis (PCA), which reveals that the main axis of variance (Eigenvector 1) is co-directional with a strong anti-correlation between these two measurements. We aim to determine whether the dominance of two Eigenvectors, originally discovered over two decades ago, is replicated in newer high-quality quasar samples. If so, we aim to test if a non-linear approach is an improvement on the linear PCA method by finding two new parameters which represent a more accurate projection of the variances than the Eigenvectors recovered from PCA. We selected quasars from the XSHOOTER archive and a major quasar catalog to build high quality samples. These samples were tested with PCA. We find that the new high-quality samples do indeed have two dominant Eigenvectors as originally discovered. Subsequently we find that the fitting of a non-linear decay curve to the main sequence allows a new plane spanned by linearly independent axes to be defined, based on the distance along the decay curve as the main axis and the distance of each quasar datapoint from the curve as the secondary axis respectively. The results show that it is possible to define a new plane based on the quasar main sequence which accounts for the majority of the variance. The most likely candidate for the new main axis is an anti-correlation with black hole mass. In this case the secondary axis likely represents luminosity. However, given the results of previous studies, inclination angle likely plays a role in H$\beta{}$ width.
AI Key Findings
Get AI-generated insights about this paper's methodology, results, significance, and more — seven facets brought into focus.
Impact
Paper Details
Authors
PDF Preview
Key Terms
Citation Network
Current paper (gray), citations (green), references (blue)
Display is limited for performance on very large graphs.
Discussion 0