Summary
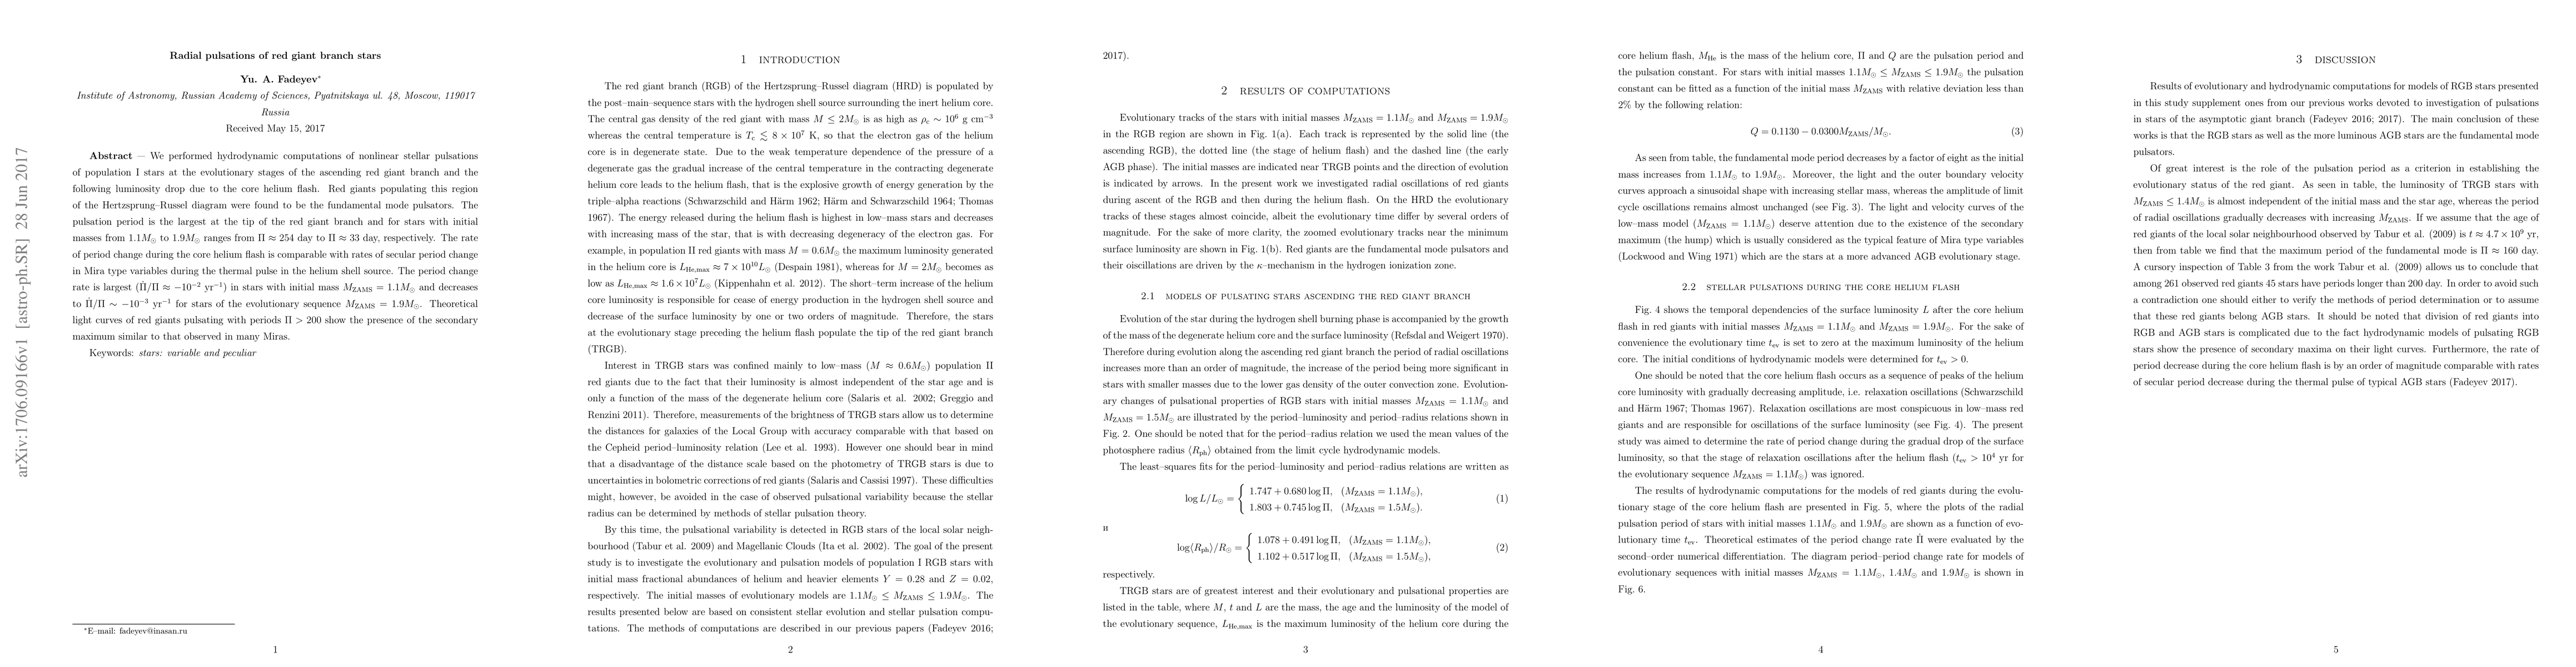
We performed hydrodynamic computations of nonlinear stellar pulsations of population I stars at the evolutionary stages of the ascending red giant branch and the following luminosity drop due to the core helium flash. Red giants populating this region of the Hertzsprung--Russel diagram were found to be the fundamental mode pulsators. The pulsation period is the largest at the tip of the red giant branch and for stars with initial masses from 1.1M_\odot to 1.9M_\odot ranges from 254 day to 33 day, respectively. The rate of period change during the core helium flash is comparable with rates of secular period change in Mira type variables during the thermal pulse in the helium shell source. The period change rate is largest (\dot\Pi/\Pi\approx -0.01 yr^{-1}) in stars with initial mass Mzams=1.1M_\odot and decreases to \dot\Pi/\Pi\sim -0.001\ yr^{-1} for stars of the evolutionary sequence Mzams=1.9M_\odot. Theoretical light curves of red giants pulsating with periods Pi > 200 day show the presence of the secondary maximum similar to that observed in many Miras.
AI Key Findings
Get AI-generated insights about this paper's methodology, results, and significance.
Paper Details
PDF Preview
Key Terms
Citation Network
Current paper (gray), citations (green), references (blue)
Display is limited for performance on very large graphs.
Similar Papers
Found 4 papers| Title | Authors | Year | Actions |
|---|
Comments (0)