Publication
Metrics
AI Quick Summary
This study uses 1.4 GHz radio continuum emission to estimate star formation rates (SFRs) in weak emission line galaxies within blue early-type galaxies, finding a median SFR of 0.23 $\pm$ 0.06 M$_{\odot}$yr$^{-1}$. The results suggest that radio emission is due to star formation, with SFRs declining with increasing stellar velocity dispersion, likely due to AGN feedback.
Paper Preview
Abstract
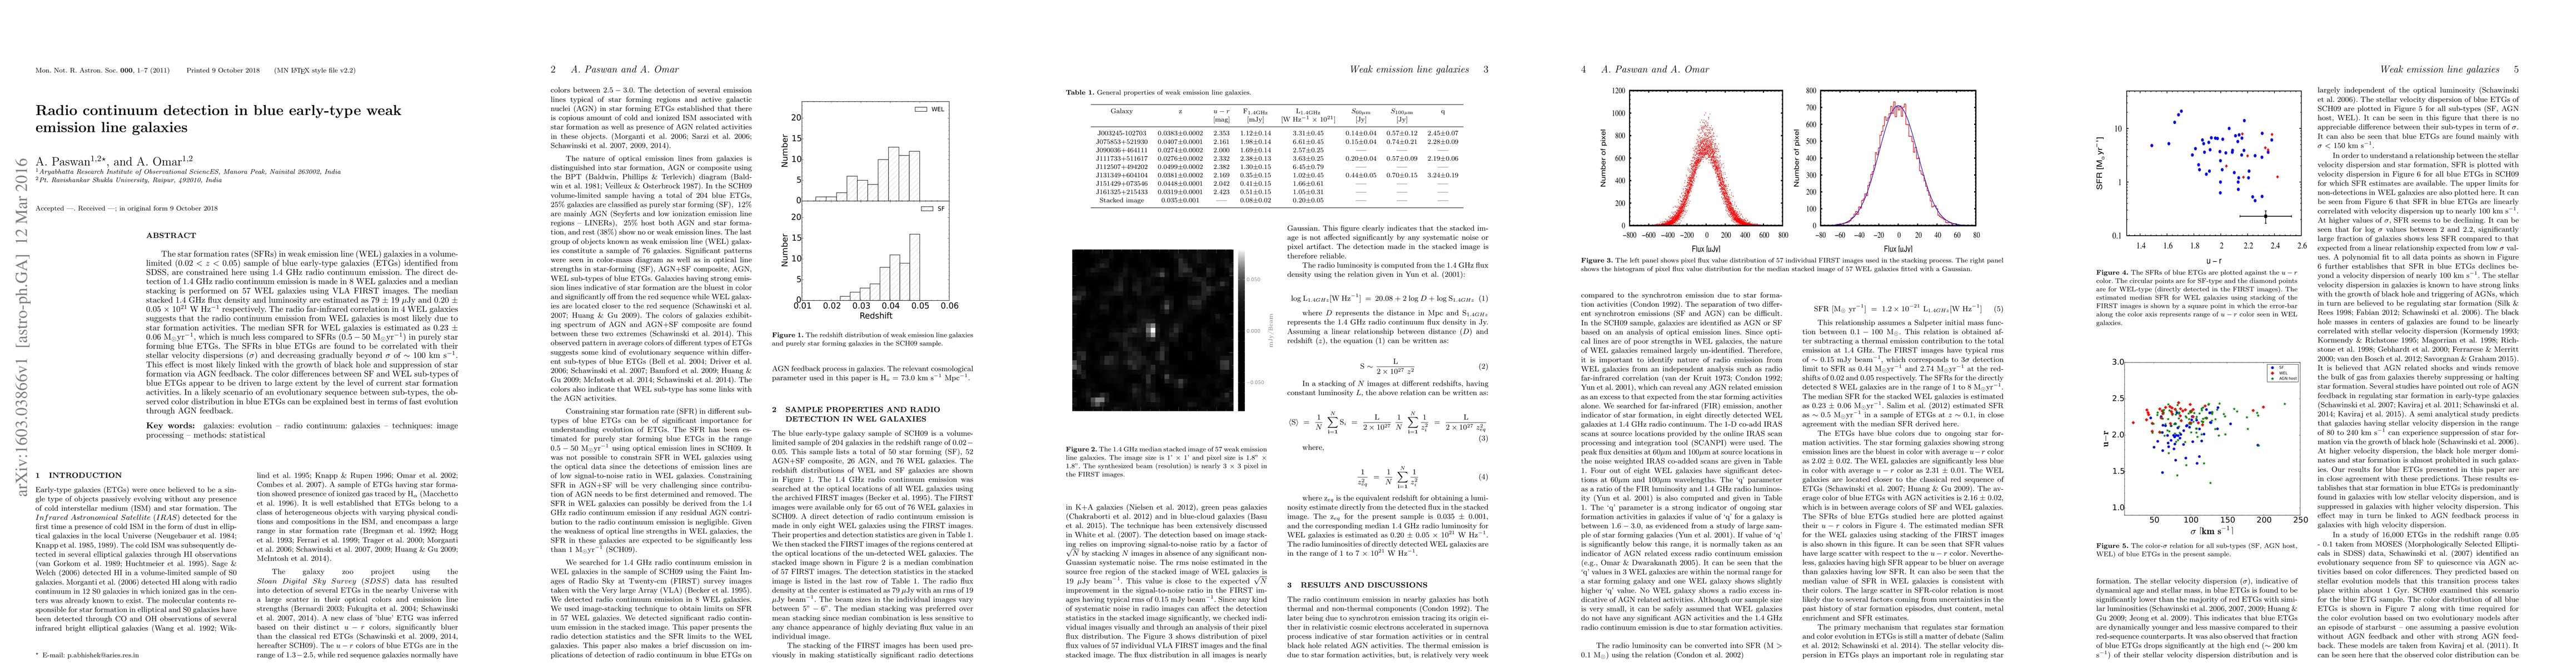
The star formation rates (SFRs) in weak emission line (WEL) galaxies in a volume-limited ($0.02 < z < 0.05$) sample of blue early-type galaxies (ETGs) identified from SDSS, are constrained here using 1.4 GHz radio continuum emission. The direct detection of 1.4 GHz radio continuum emission is made in 8 WEL galaxies and a median stacking is performed on 57 WEL galaxies using VLA FIRST images. The median stacked 1.4 GHz flux density and luminosity are estimated as 79 $\pm$ 19 $\mu$Jy and 0.20 $\pm$ 0.05 $\times$ 10$^{21}$ W Hz$^{-1}$ respectively. The radio far-infrared correlation in 4 WEL galaxies suggests that the radio continuum emission from WEL galaxies is most likely due to star formation activities. The median SFR for WEL galaxies is estimated as 0.23 $\pm$ 0.06 M$_{\odot}$yr$^{-1}$, which is much less compared to SFRs ($0.5 - 50$ M$_{\odot}$yr$^{-1}$) in purely star forming blue ETGs. The SFRs in blue ETGs are found to be correlated with their stellar velocity dispersions ($\sigma$) and decreasing gradually beyond $\sigma$ of $\sim 100$ km s$^{-1}$. This effect is most likely linked with the growth of black hole and suppression of star formation via AGN feedback. The color differences between SF and WEL sub-types of blue ETGs appear to be driven to large extent by the level of current star formation activities. In a likely scenario of an evolutionary sequence between sub-types, the observed color distribution in blue ETGs can be explained best in terms of fast evolution through AGN feedback.
AI Key Findings
Get AI-generated insights about this paper's methodology, results, significance, and more — seven facets brought into focus.
Impact
Paper Details
PDF Preview
Key Terms
Citation Network
Current paper (gray), citations (green), references (blue)
Display is limited for performance on very large graphs.
Discussion 0