Summary
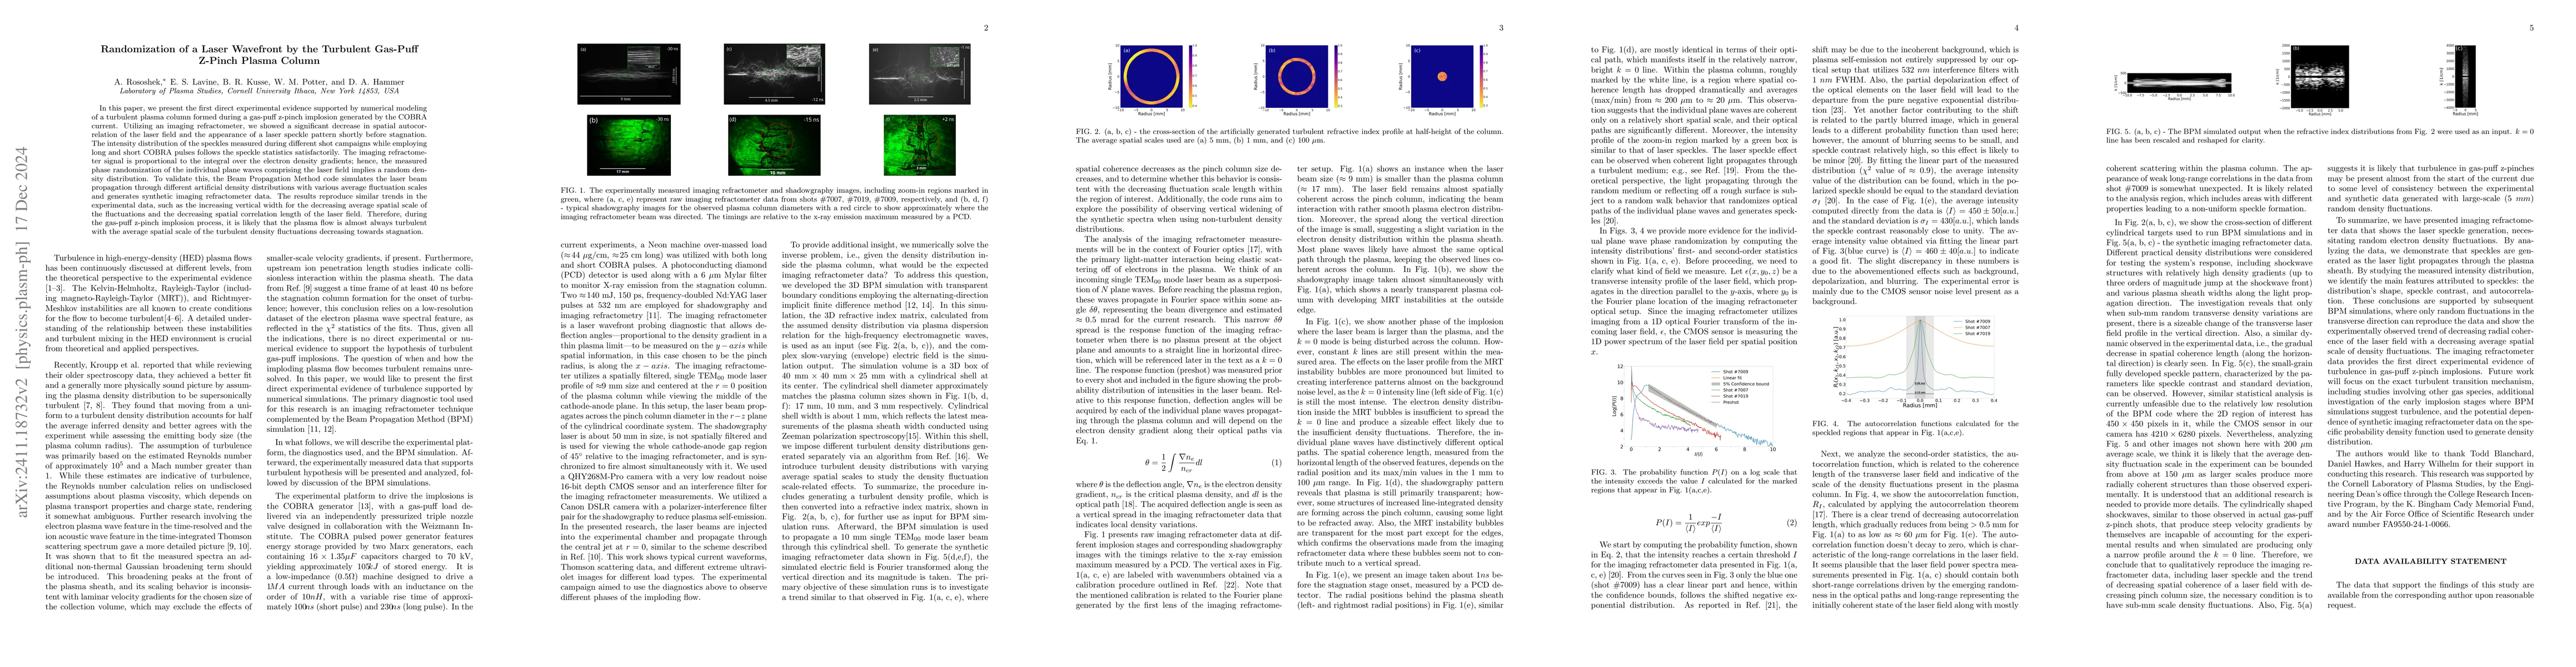
In this paper, we present the first direct experimental evidence supported by numerical modeling of a turbulent plasma column formed during a gas-puff z-pinch implosion generated by COBRA current. Utilizing an imaging refractometer, we show a significant decrease in spatial autocorrelation of the laser field and the appearance of a laser speckle pattern shortly before stagnation. The intensity distribution of the speckles measured during different shot campaigns while employing long and short COBRA pulses follows the speckle statistics satisfactorily. The imaging refractometer data is proportional to the integral over electron density gradients; hence, the measured phase randomization of the individual plane waves comprising the laser field implies random density distribution. To validate this, the Beam Propagation Method code simulates the laser beam propagation through different artificial density distributions with various average fluctuation scales and generates synthetic imaging refractometer data. The results reproduce similar trends in the experimental data, such as the increasing vertical width for the decreasing average spatial scale of the fluctuations and decreasing spatial correlation length of the laser field. Therefore, during the gas-puff z-pinch implosion process, it is likely that the plasma flow is almost always turbulent with the average spatial scale of the turbulent density fluctuations decreasing towards stagnation.
AI Key Findings
Get AI-generated insights about this paper's methodology, results, and significance.
Paper Details
PDF Preview
Similar Papers
Found 4 papersNo citations found for this paper.
Comments (0)