Rapid and cost-effective evaluation of bacterial viability using fluorescence spectroscopy
Publication
Metrics
AI Quick Summary
This paper presents a cost-effective method using fluorescence spectroscopy and an optrode to evaluate bacterial viability in Escherichia coli mixtures stained with SYTO 9 and propidium iodide. The multi-spectra support vector regression (SVR) method proved most reliable for predicting live bacterial percentages in samples.
Paper Preview
Abstract
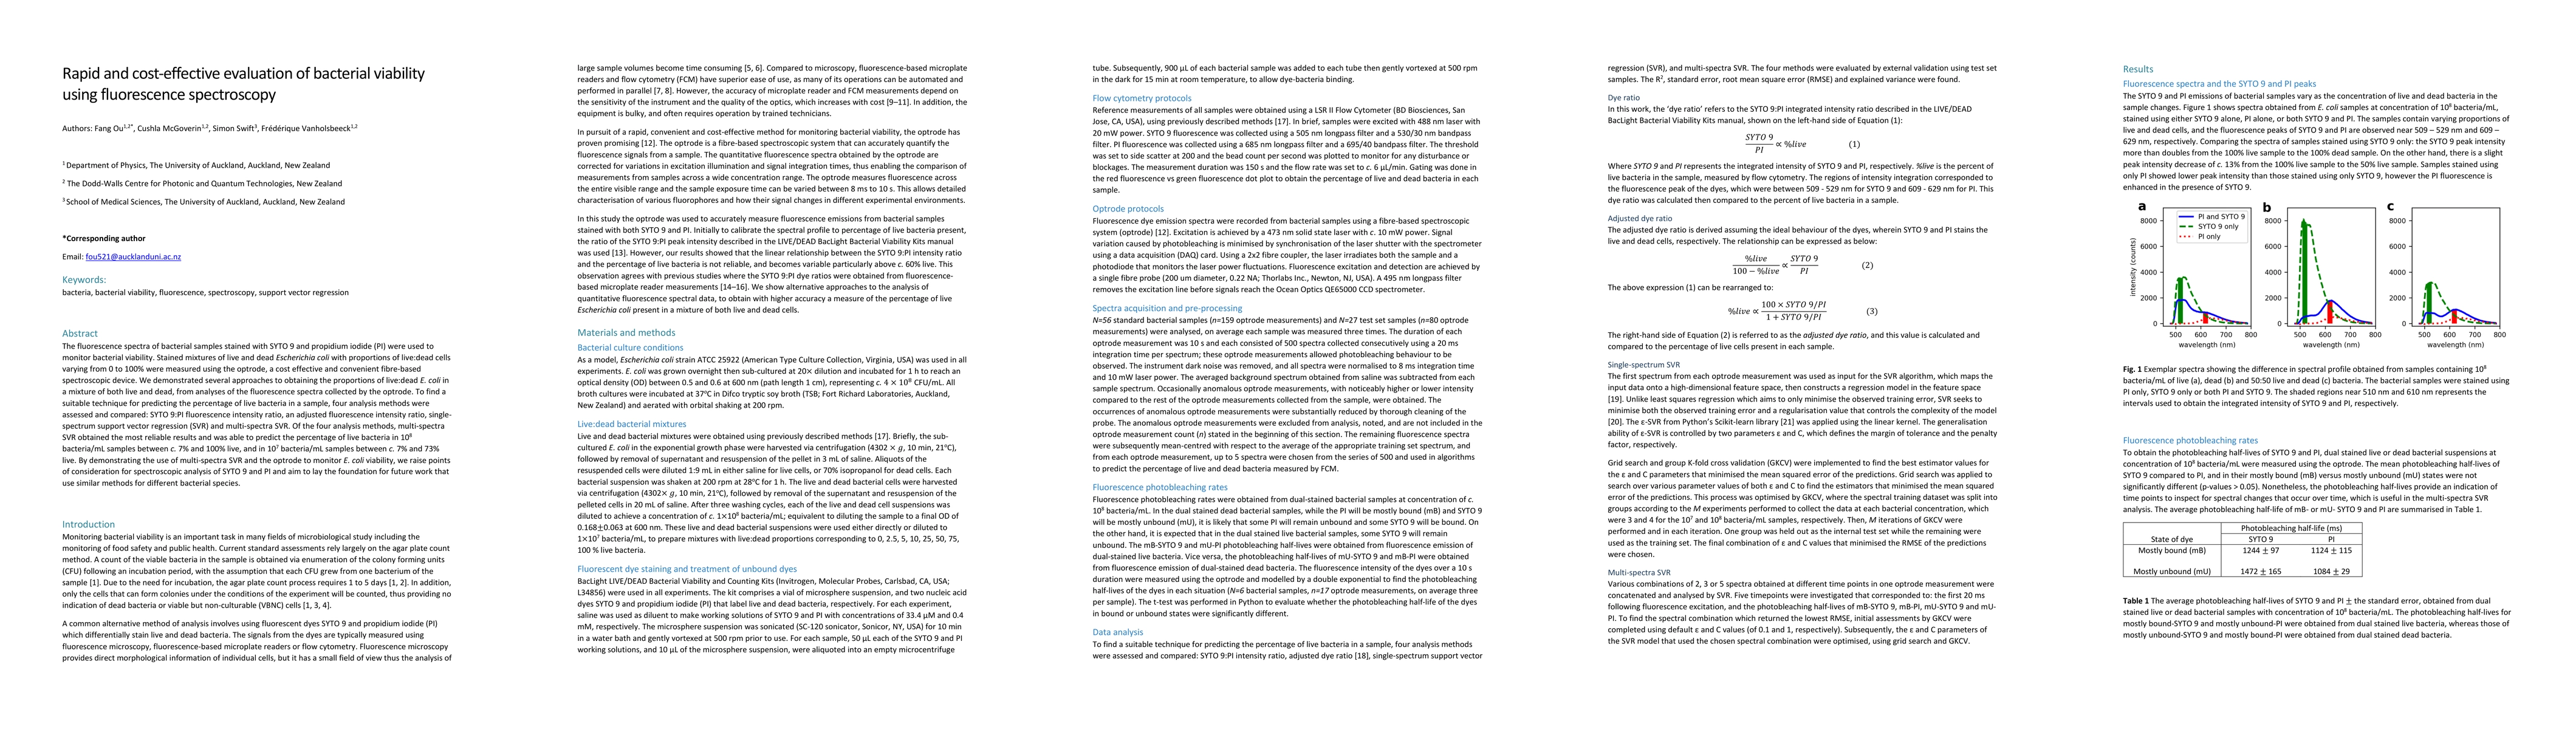
The fluorescence spectra of bacterial samples stained with SYTO 9 and propidium iodide (PI) were used to monitor bacterial viability. Stained mixtures of live and dead Escherichia coli with proportions of live:dead cells varying from 0 to 100% were measured using the optrode, a cost effective and convenient fibre-based spectroscopic device. We demonstrated several approaches to obtaining the proportions of live:dead E. coli in a mixture of both live and dead, from analyses of the fluorescence spectra collected by the optrode. To find a suitable technique for predicting the percentage of live bacteria in a sample, four analysis methods were assessed and compared: SYTO 9:PI fluorescence intensity ratio, an adjusted fluorescence intensity ratio, single-spectrum support vector regression (SVR) and multi-spectra SVR. Of the four analysis methods, multi-spectra SVR obtained the most reliable results and was able to predict the percentage of live bacteria in 10^8 bacteria/mL samples between c. 7% and 100% live, and in 10^7 bacteria/mL samples between c. 7% and 73% live. By demonstrating the use of multi-spectra SVR and the optrode to monitor E. coli viability, we raise points of consideration for spectroscopic analysis of SYTO 9 and PI and aim to lay the foundation for future work that use similar methods for different bacterial species.
AI Key Findings
Get AI-generated insights about this paper's methodology, results, significance, and more — seven facets brought into focus.
Impact
Paper Details
PDF Preview
Key Terms
Citation Network
Current paper (gray), citations (green), references (blue)
Display is limited for performance on very large graphs.
Discussion 0