Summary
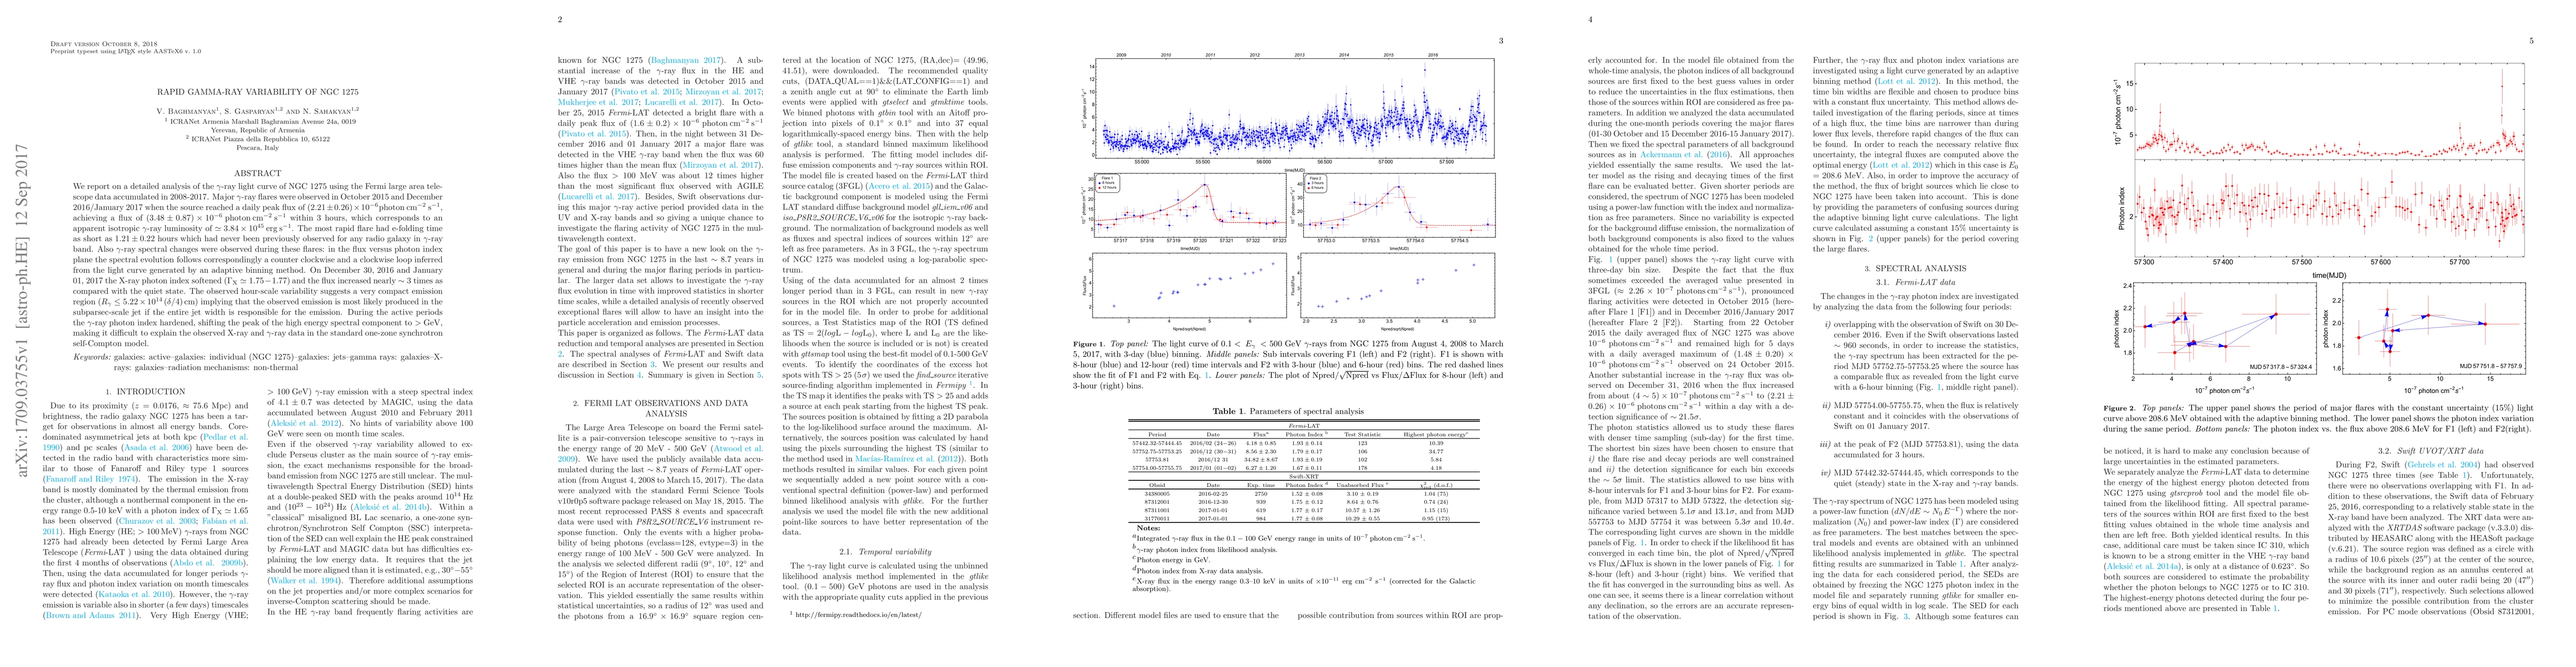
We report on a detailed analysis of the $\gamma$-ray light curve of NGC 1275 using the Fermi large area telescope data accumulated in 2008-2017. Major $\gamma$-ray flares were observed in October 2015 and December 2016/January 2017 when the source reached a daily peak flux of $(2.21\pm0.26)\times10^{-6}\:{\rm photon\:cm^{-2}\:s^{-1}}$, achieving a flux of $(3.48\pm0.87)\times10^{-6}\:{\rm photon\:cm^{-2}\:s^{-1}}$ within 3 hours, which corresponds to an apparent isotropic $\gamma$-ray luminosity of $\simeq3.84\times10^{45}\:{\rm erg\:s^{-1}}$. The most rapid flare had e-folding time as short as $1.21\pm0.22$ hours which had never been previously observed for any radio galaxy in $\gamma$-ray band. Also $\gamma$-ray spectral changes were observed during these flares: in the flux versus photon index plane the spectral evolution follows correspondingly a counter clockwise and a clockwise loop inferred from the light curve generated by an adaptive binning method. On December 30, 2016 and January 01, 2017 the X-ray photon index softened ($\Gamma_{\rm X}\simeq 1.75-1.77$) and the flux increased nearly $\sim3$ times as compared with the quiet state. The observed hour-scale variability suggests a very compact emission region ($R_\gamma\leq5.22\times10^{14}\:(\delta/4)\:{\rm cm}$) implying that the observed emission is most likely produced in the subparsec-scale jet if the entire jet width is responsible for the emission. During the active periods the $\gamma$-ray photon index hardened, shifting the peak of the high energy spectral component to $>{\rm GeV}$, making it difficult to explain the observed X-ray and $\gamma$-ray data in the standard one-zone synchrotron self-Compton model.
AI Key Findings
Get AI-generated insights about this paper's methodology, results, and significance.
Paper Details
PDF Preview
Key Terms
Citation Network
Current paper (gray), citations (green), references (blue)
Display is limited for performance on very large graphs.
Similar Papers
Found 4 papers| Title | Authors | Year | Actions |
|---|
Comments (0)