Summary
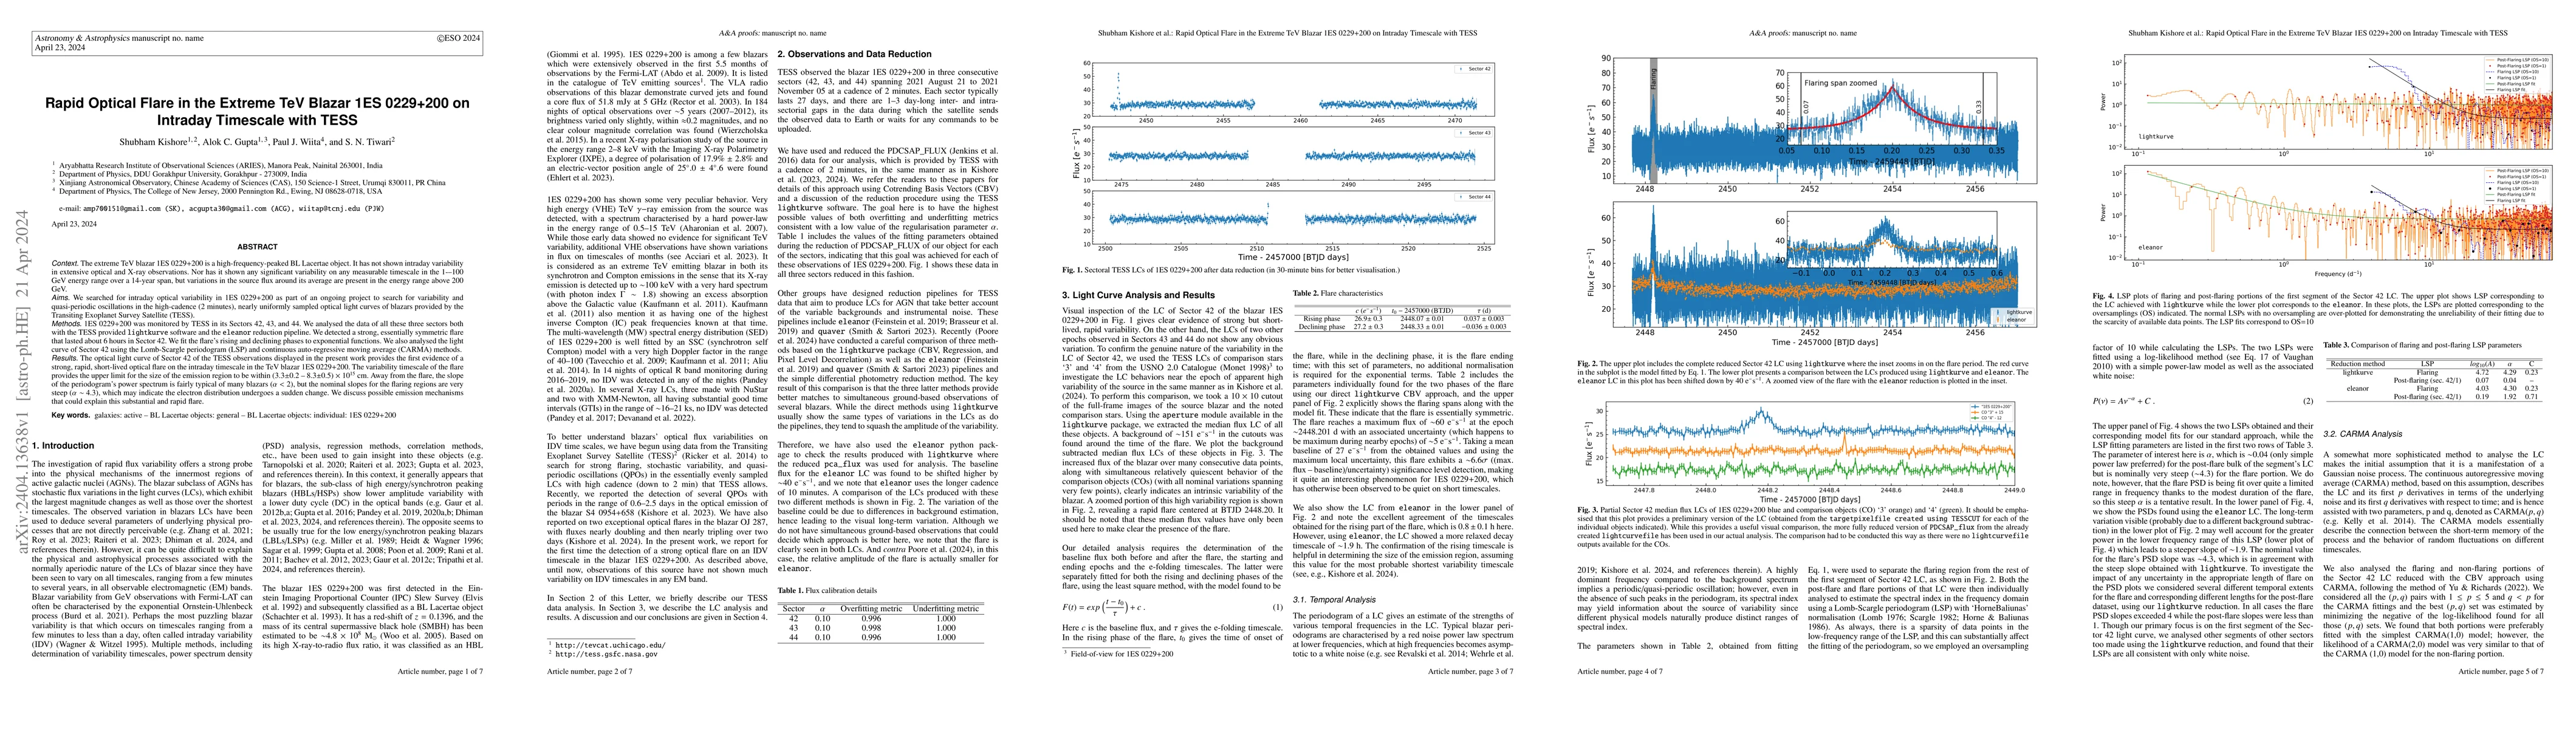
The extreme TeV blazar 1ES 0229+200 is a high-frequency-peaked BL Lacertae object. It has not shown intraday variability in extensive optical and X-ray observations. Nor has it shown any significant variability on any measurable timescale in the 1-100 GeV energy range over a 14-year span, but variations in the source flux around its average are present in the energy range above 200 GeV. We searched for intraday optical variability in 1ES 0229+200 as part of an ongoing project to search for variability and quasi-periodic oscillations in the high-cadence, nearly uniformly sampled optical light curves of blazars provided by the Transiting Exoplanet Survey Satellite (TESS). 1ES 0229+200 was monitored by TESS in its Sectors 42, 43 and 44. We analysed the data of all these sectors both with the TESS provided lightkurve software and the eleanor reduction pipeline. We detected a strong, essentially symmetric flare that lasted ~6 hours in Sector 42. We fit the flare's rising and declining phases to exponential functions. We also analysed the light curve of Sector 42 using the Lomb-Scargle periodogram (LSP) and continuous auto-regressive moving average (CARMA) methods. The Sector 42 light curve displayed in the present work provides the first evidence of a strong, rapid, short-lived optical flare on the intraday timescale in 1ES 0229+200. The variability timescale of the flare provides the upper limit for the size of the emission region to be within (3.3\pm0.2 - 8.3\pm0.5)x10^{15}cm. Away from the flare, the slope of the periodogram's power spectrum is fairly typical of many blazars (\alpha<2), but the nominal slopes for the flaring regions are very steep (\alpha~4.3), which may indicate the electron distribution undergoes a sudden change. We discuss possible emission mechanisms that could explain this substantial and rapid flare.
AI Key Findings
Get AI-generated insights about this paper's methodology, results, and significance.
Paper Details
PDF Preview
Key Terms
Citation Network
Current paper (gray), citations (green), references (blue)
Display is limited for performance on very large graphs.
Similar Papers
Found 4 papersX-ray Polarization of the BL Lac Type Blazar 1ES 0229+200
Fei Xie, Juri Poutanen, Alessandro Di Marco et al.
No citations found for this paper.
Comments (0)