Real and complex behavior for networks of coupled logistic maps
Publication
Metrics
AI Quick Summary
This paper establishes a framework for analyzing the dynamics of networks composed of coupled logistic maps, both real and complex, and explores how network connectivity influences system behavior. It introduces extensions of Julia and Mandelbrot sets for networked maps and examines how perturbations in network structure affect dynamics, using analytical and numerical methods.
Paper Preview
Abstract
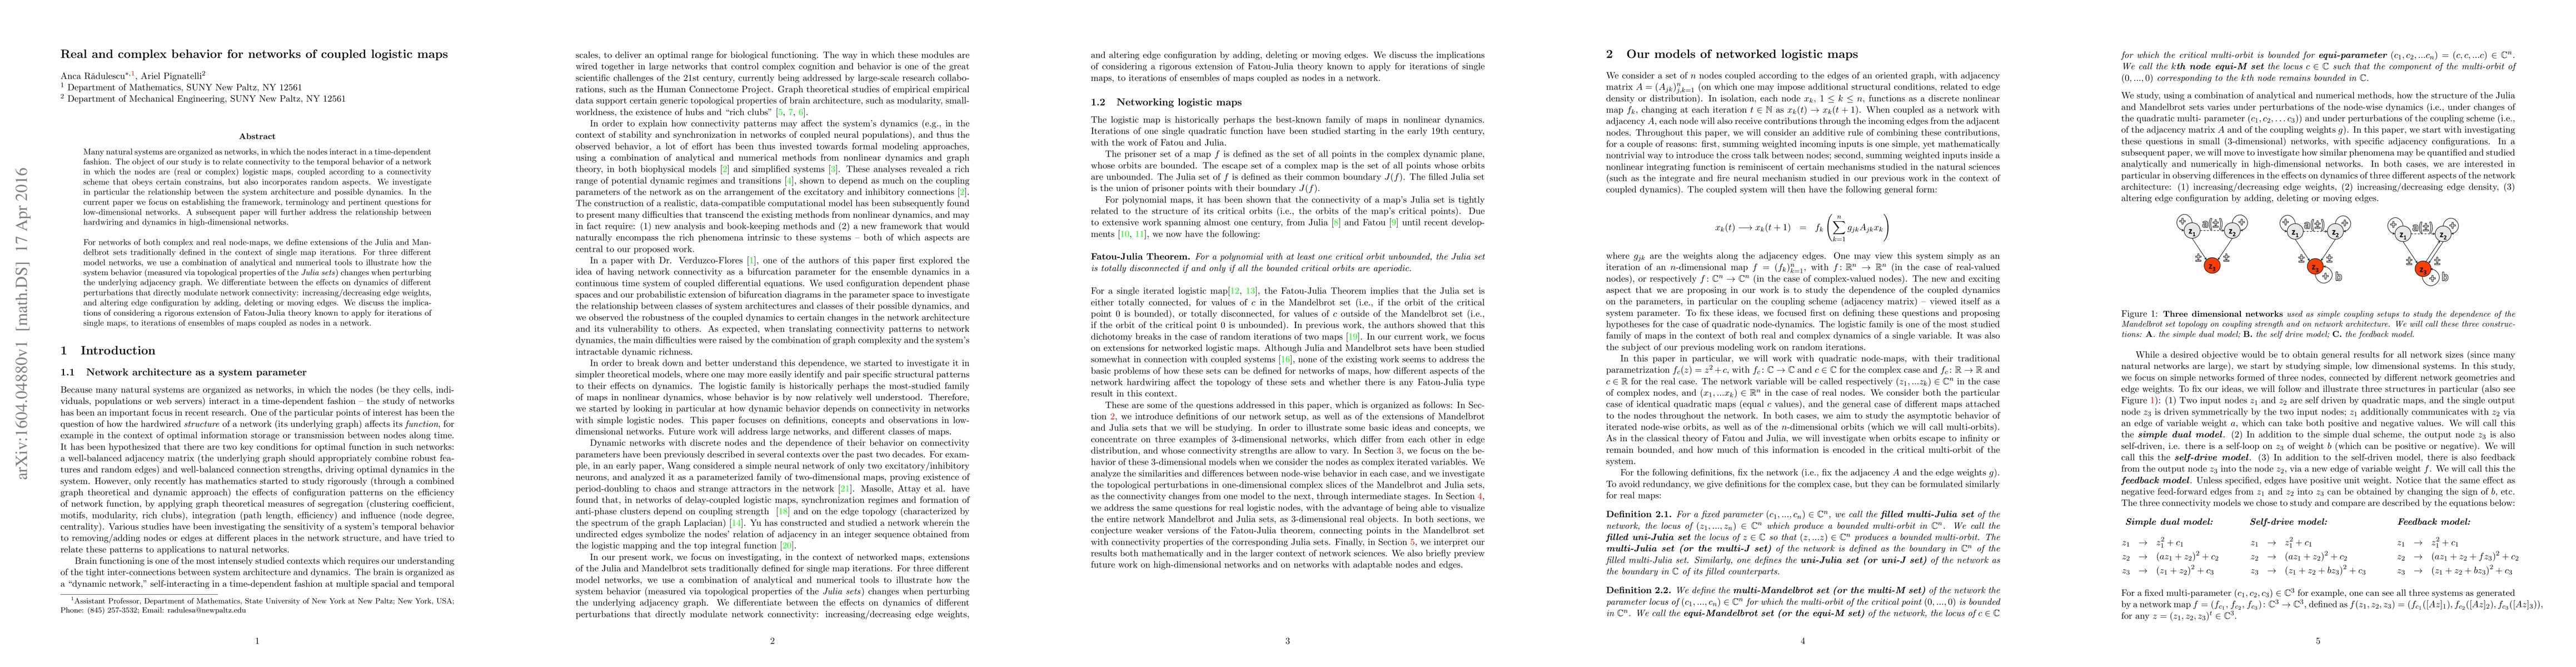
Many natural systems are organized as networks, in which the nodes interact in a time-dependent fashion. The object of our study is to relate connectivity to the temporal behavior of a network in which the nodes are (real or complex) logistic maps, coupled according to a connectivity scheme that obeys certain constrains, but also incorporates random aspects. We investigate in particular the relationship between the system architecture and possible dynamics. In the current paper we focus on establishing the framework, terminology and pertinent questions for low-dimensional networks. A subsequent paper will further address the relationship between hardwiring and dynamics in high-dimensional networks. For networks of both complex and real node-maps, we define extensions of the Julia and Mandelbrot sets traditionally defined in the context of single map iterations. For three different model networks, we use a combination of analytical and numerical tools to illustrate how the system behavior (measured via topological properties of the Julia sets) changes when perturbing the underlying adjacency graph. We differentiate between the effects on dynamics of different perturbations that directly modulate network connectivity: increasing/decreasing edge weights, and altering edge configuration by adding, deleting or moving edges. We discuss the implications of considering a rigorous extension of Fatou-Julia theory known to apply for iterations of single maps, to iterations of ensembles of maps coupled as nodes in a network.
AI Key Findings
Get AI-generated insights about this paper's methodology, results, significance, and more — seven facets brought into focus.
Impact
Paper Details
PDF Preview
Key Terms
Citation Network
Current paper (gray), citations (green), references (blue)
Display is limited for performance on very large graphs.
Discussion 0