Real-Space Visualization of Frequency-Dependent Anisotropy of Atomic Vibrations
Publication
Metrics
AI Quick Summary
This paper introduces a novel technique using dark-field monochromated electron energy-loss spectroscopy to visualize frequency-dependent anisotropy in atomic vibrations, achieving high spatial and energy resolutions. Applied to strontium titanate, it reveals distinct vibrational anisotropies in oxygen atoms, paving the way for advanced studies of dielectric, optical, and thermal properties.
Paper Preview
Abstract
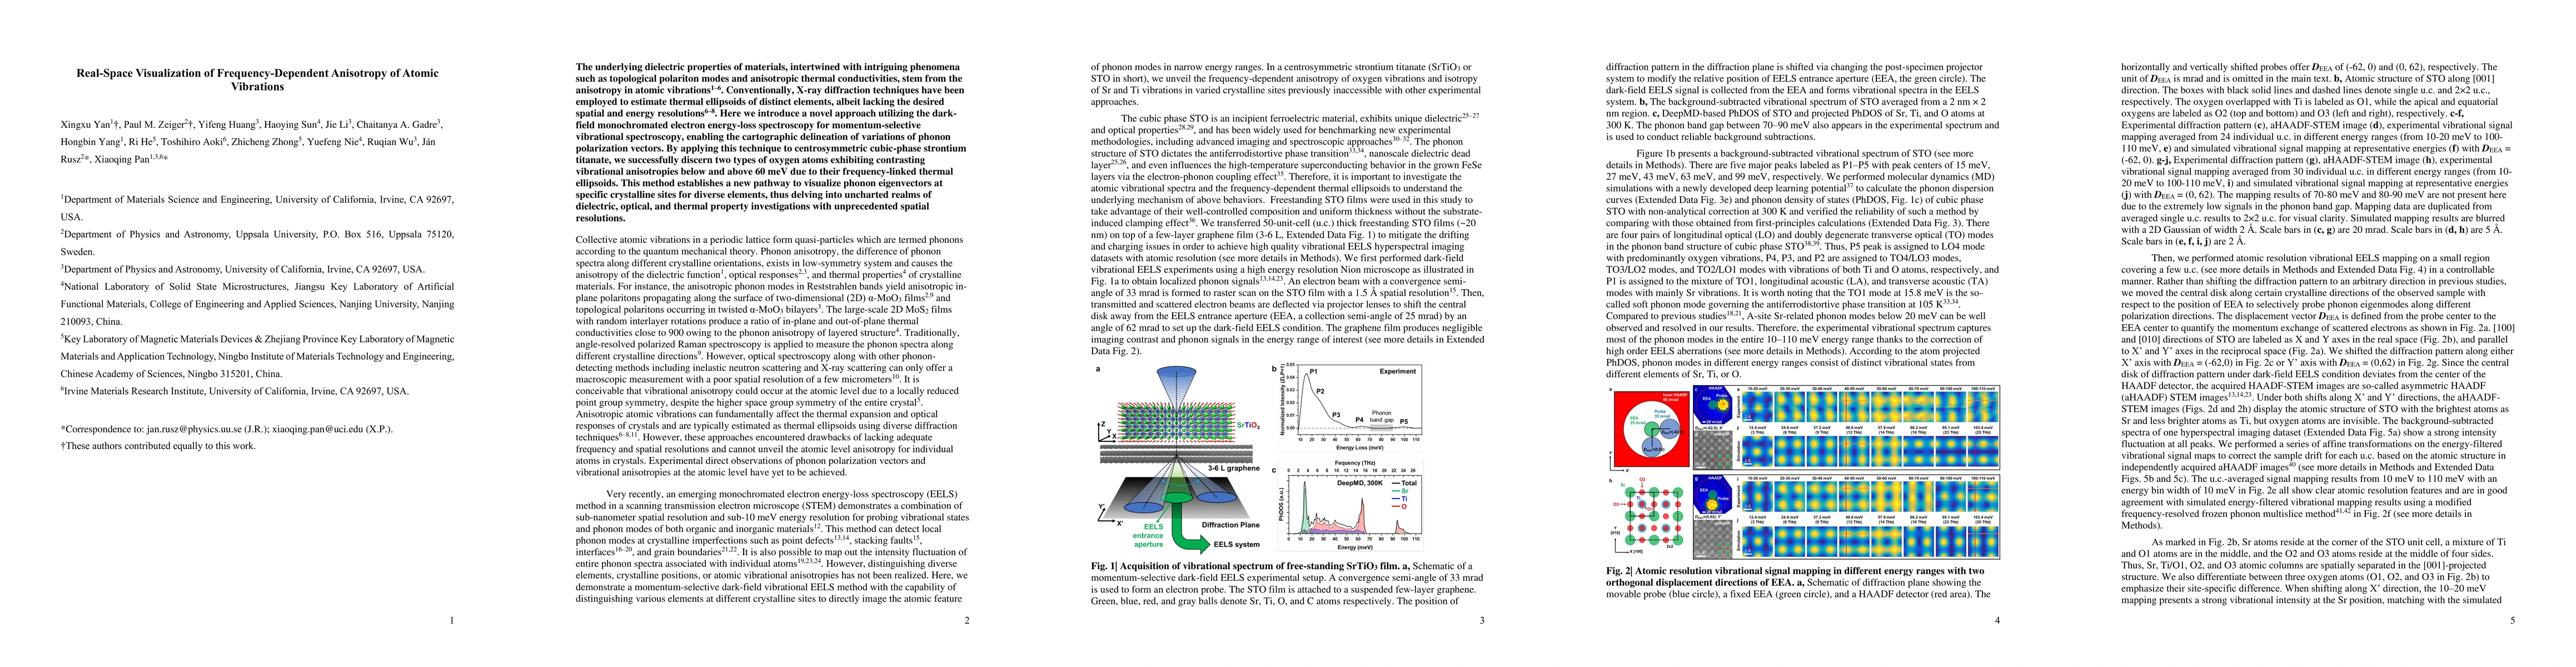
The underlying dielectric properties of materials, intertwined with intriguing phenomena such as topological polariton modes and anisotropic thermal conductivities, stem from the anisotropy in atomic vibrations. Conventionally, X-ray diffraction techniques have been employed to estimate thermal ellipsoids of distinct elements, albeit lacking the desired spatial and energy resolutions. Here we introduce a novel approach utilizing the dark-field monochromated electron energy-loss spectroscopy for momentum-selective vibrational spectroscopy, enabling the cartographic delineation of variations of phonon polarization vectors. By applying this technique to centrosymmetric cubic-phase strontium titanate, we successfully discern two types of oxygen atoms exhibiting contrasting vibrational anisotropies below and above 60 meV due to their frequency-linked thermal ellipsoids. This method establishes a new pathway to visualize phonon eigenvectors at specific crystalline sites for diverse elements, thus delving into uncharted realms of dielectric, optical, and thermal property investigations with unprecedented spatial resolutions.
AI Key Findings
Get AI-generated insights about this paper's methodology, results, significance, and more — seven facets brought into focus.
Impact
Paper Details
Authors
PDF Preview
Key Terms
Citation Network
Current paper (gray), citations (green), references (blue)
Display is limited for performance on very large graphs.
Discussion 0