Publication
Metrics
AI Quick Summary
This paper explores the graphical representation of set relations through Euler diagrams, particularly those utilizing aligned rectangles. It establishes a link between the existence of such diagrams and the order dimension of associated order relations, offering a polynomial-time algorithm for one-dimensional cases and an exponential-time algorithm for the more complex two-dimensional case.
Paper Preview
Abstract
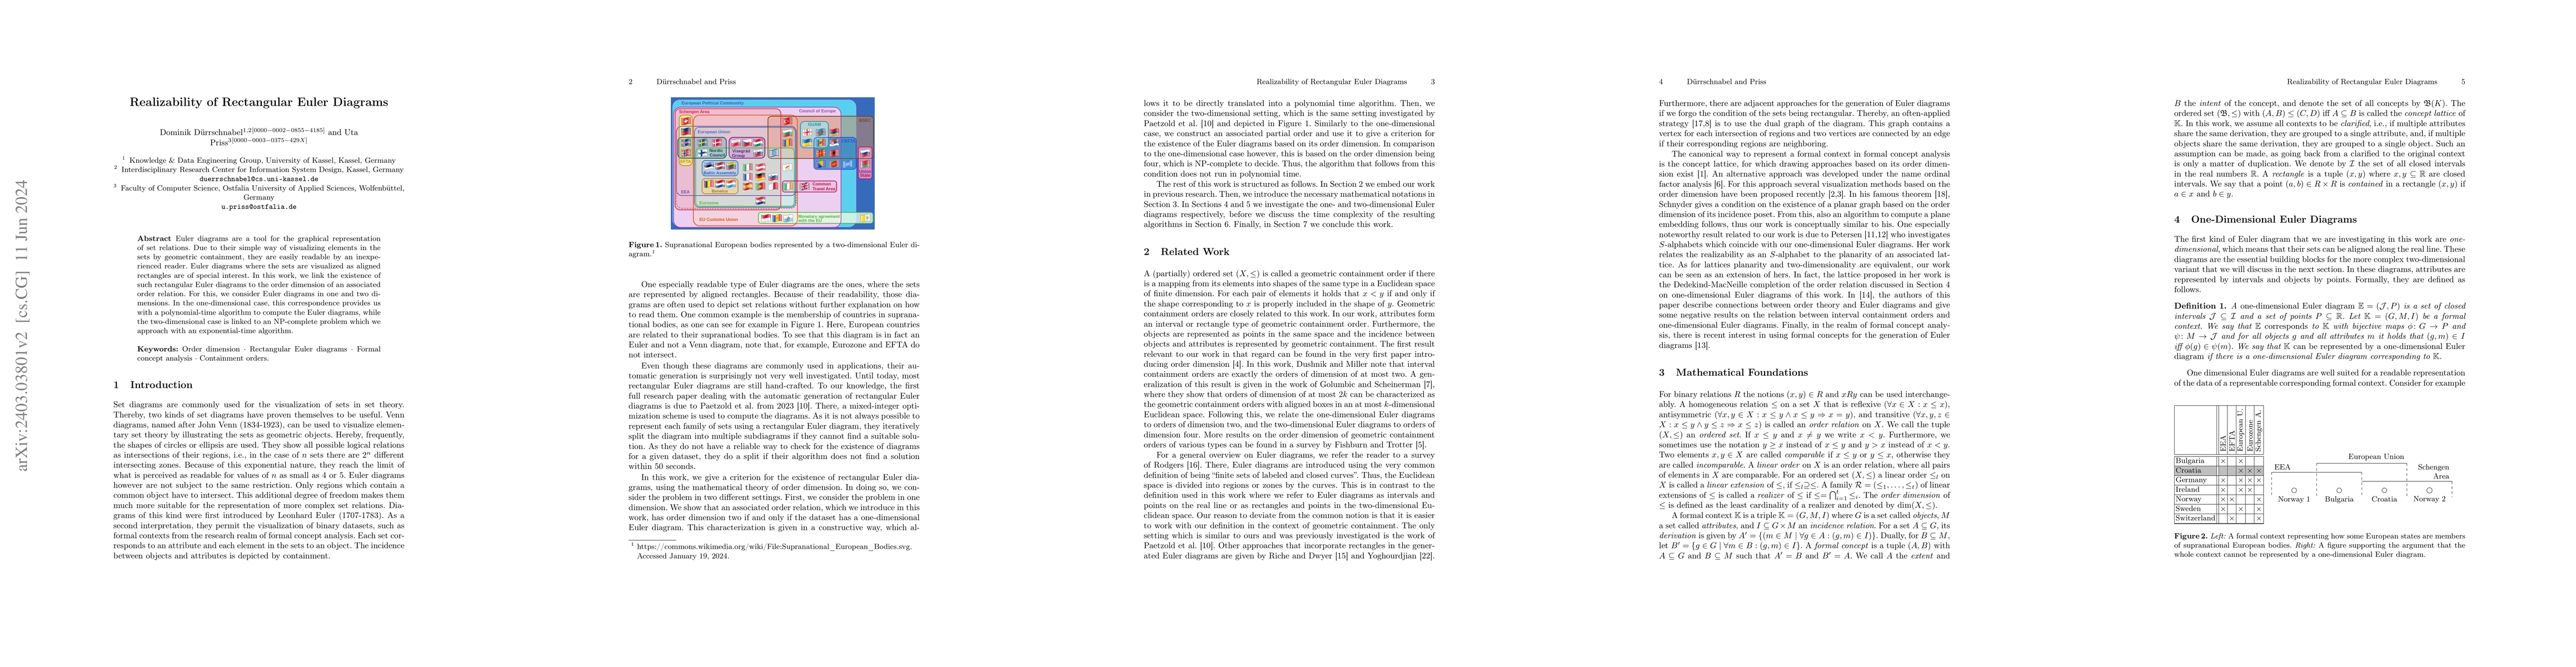
Euler diagrams are a tool for the graphical representation of set relations. Due to their simple way of visualizing elements in the sets by geometric containment, they are easily readable by an inexperienced reader. Euler diagrams where the sets are visualized as aligned rectangles are of special interest. In this work, we link the existence of such rectangular Euler diagrams to the order dimension of an associated order relation. For this, we consider Euler diagrams in one and two dimensions. In the one-dimensional case, this correspondence provides us with a polynomial-time algorithm to compute the Euler diagrams, while the two-dimensional case is linked to an NP-complete problem which we approach with an exponential-time algorithm.
AI Key Findings
Get AI-generated insights about this paper's methodology, results, significance, and more — seven facets brought into focus.
Impact
Paper Details
Authors
PDF Preview
Key Terms
Citation Network
Current paper (gray), citations (green), references (blue)
Display is limited for performance on very large graphs.
Discussion 0