ReconMap: An interactive visualisation of human metabolism
Publication
Metrics
Paper Preview
Abstract
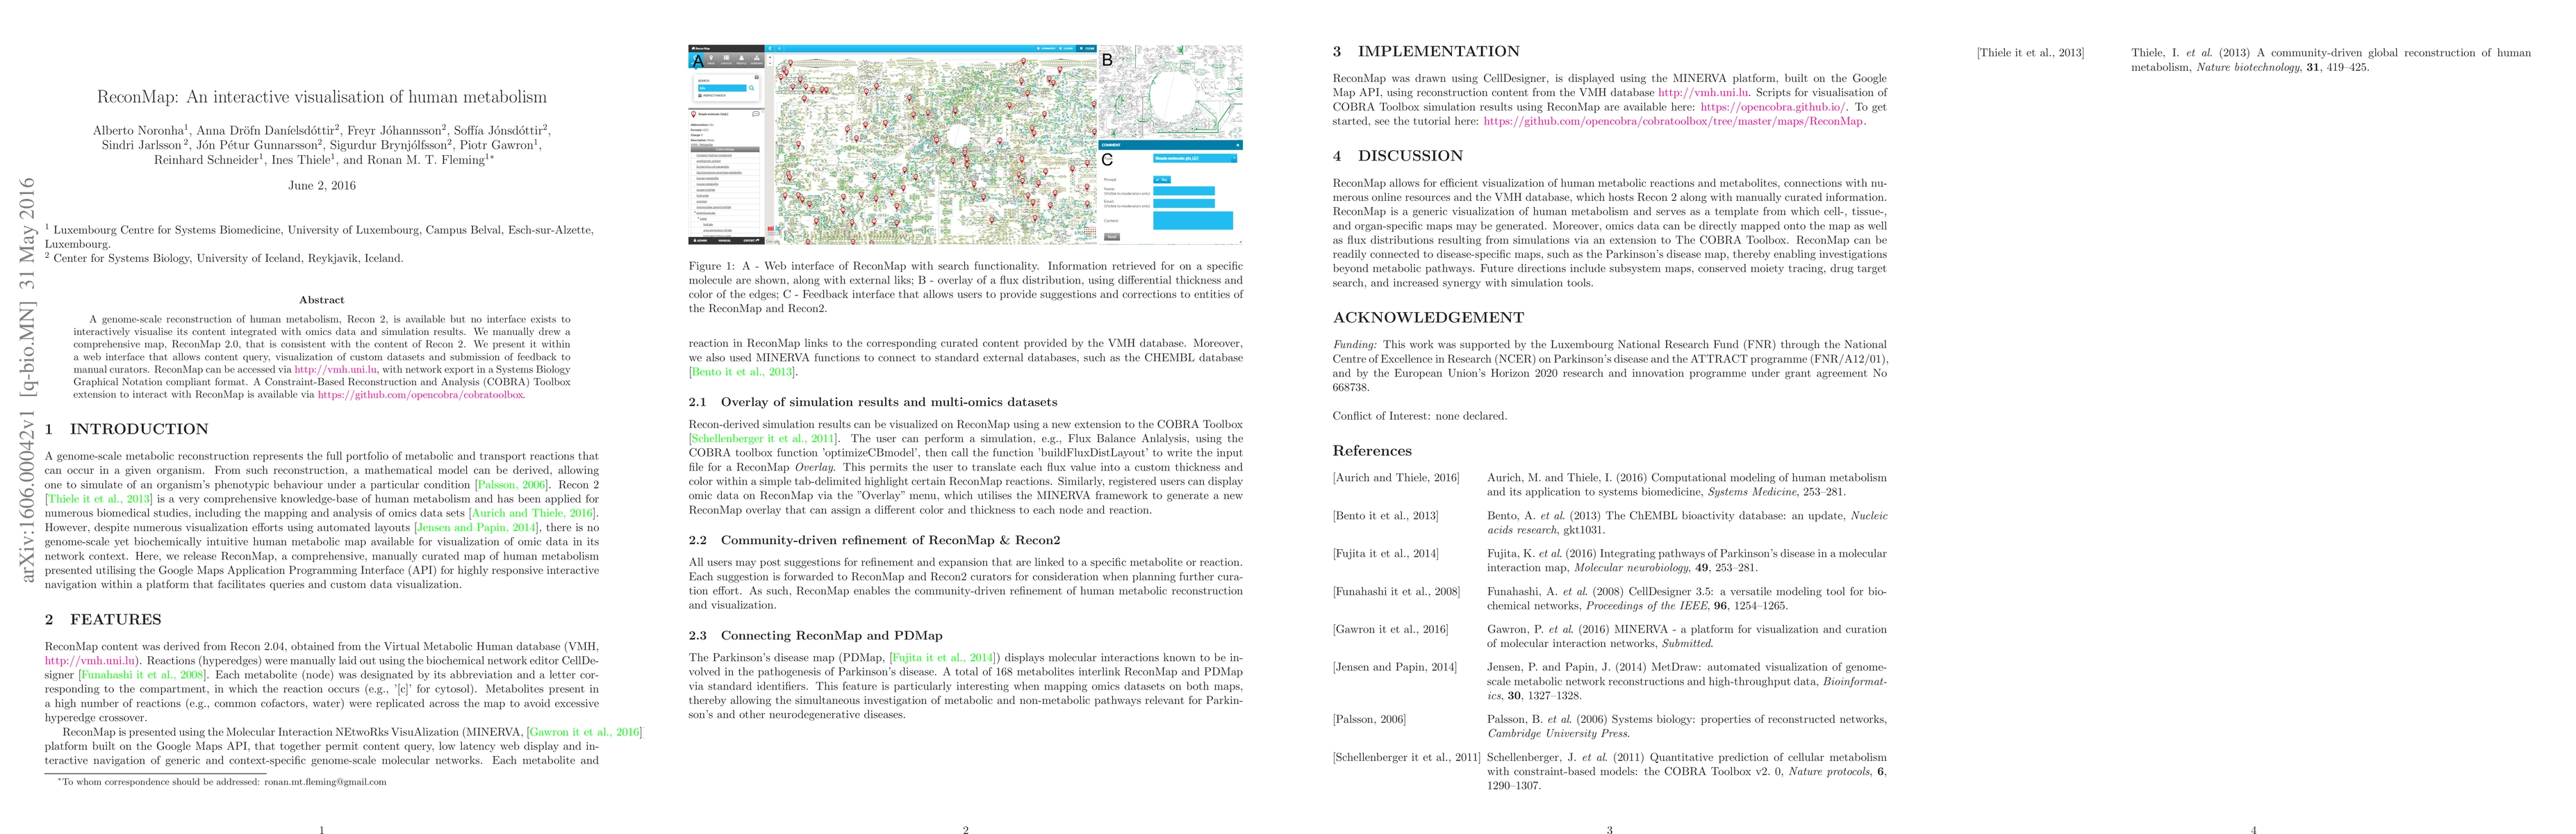
A genome-scale reconstruction of human metabolism, Recon 2, is available but no interface exists to interactively visualise its content integrated with omics data and simulation results. We manually drew a comprehensive map, ReconMap 2.0, that is consistent with the content of Recon 2. We present it within a web interface that allows content query, visualization of custom datasets and submission of feedback to manual curators. ReconMap can be accessed via http://vmh.uni.lu, with network export in a Systems Biology Graphical Notation compliant format. A Constraint-Based Reconstruction and Analysis (COBRA) Toolbox extension to interact with ReconMap is available via https://github.com/opencobra/cobratoolbox.
AI Key Findings
Get AI-generated insights about this paper's methodology, results, significance, and more — seven facets brought into focus.
Impact
Paper Details
PDF Preview
Key Terms
Citation Network
Current paper (gray), citations (green), references (blue)
Display is limited for performance on very large graphs.
Discussion 0