Recording Reusable and Guided Analytics From Interaction Histories
Publication
Metrics
Paper Preview
Abstract
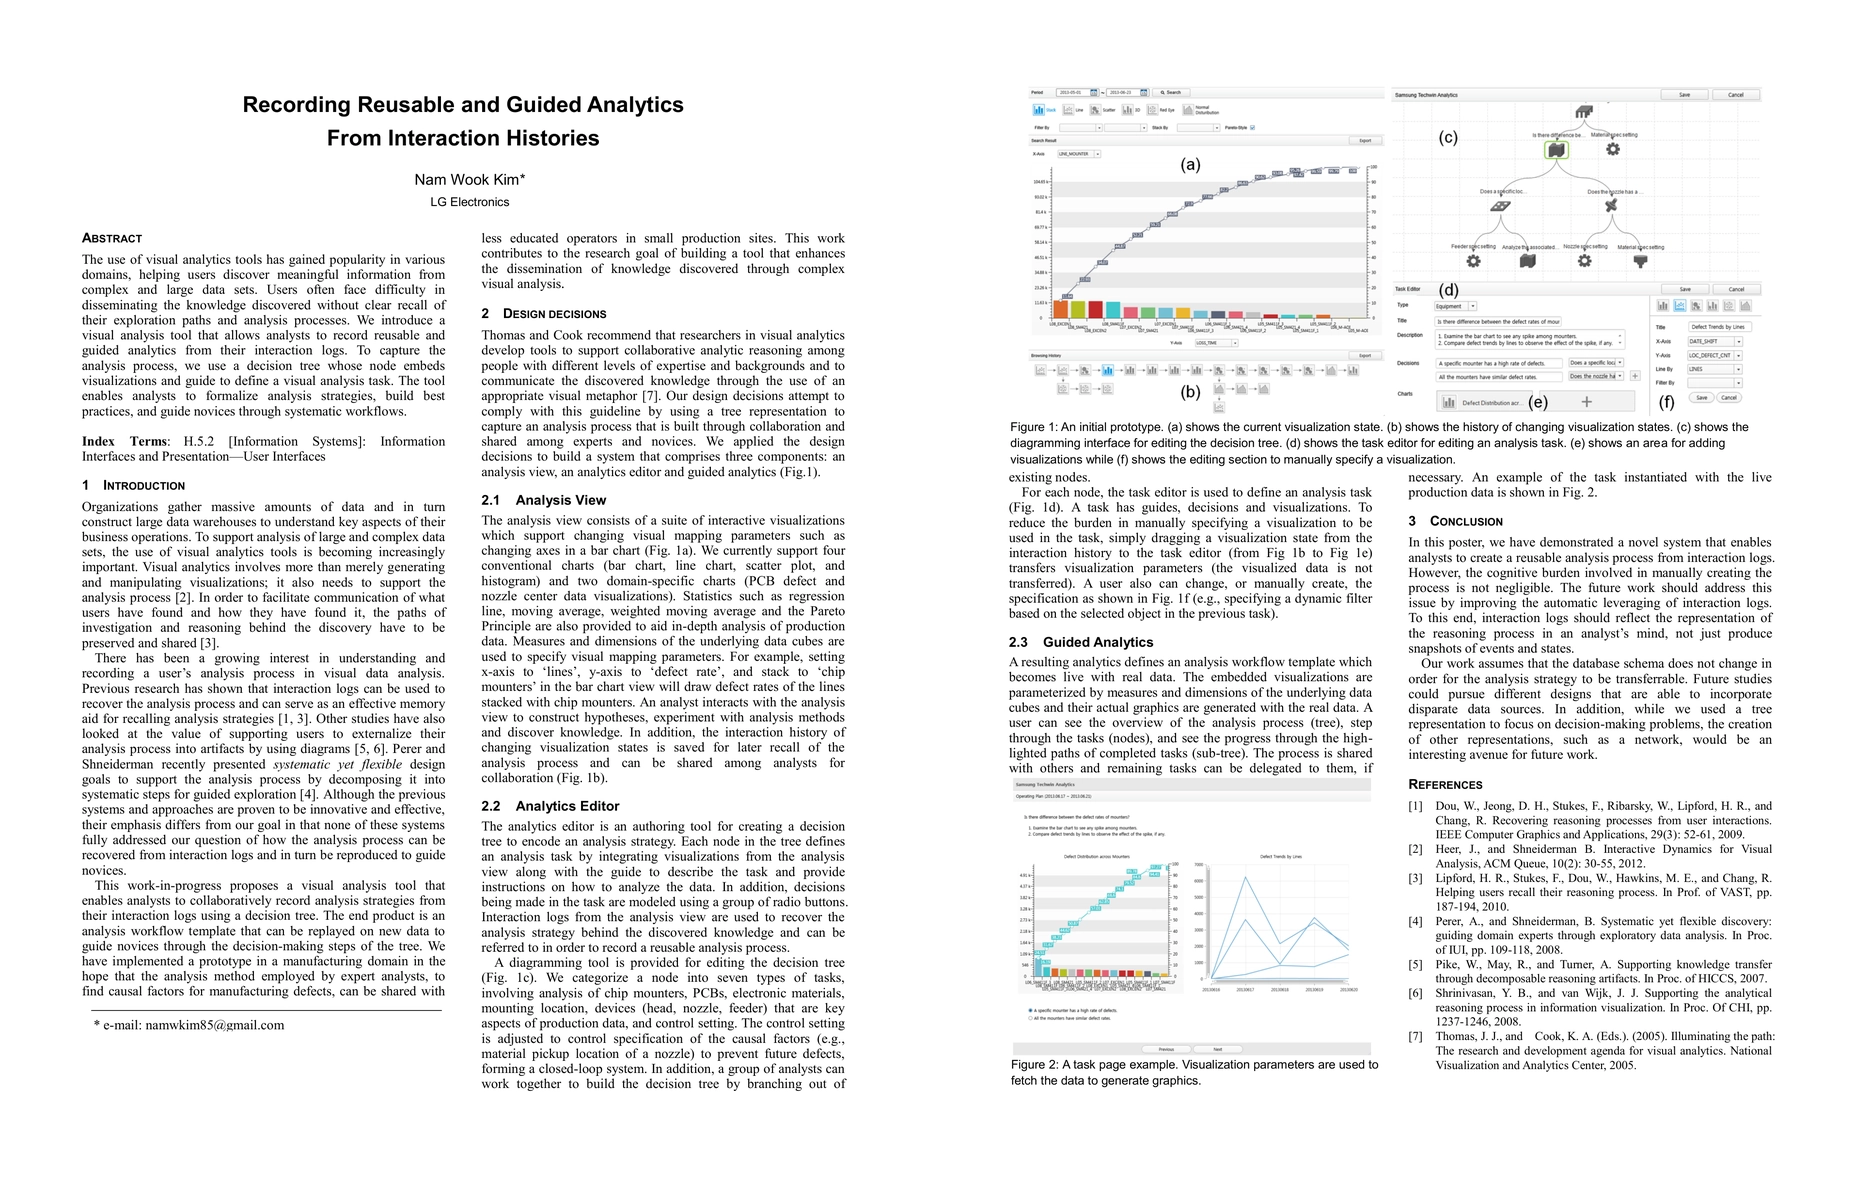
The use of visual analytics tools has gained popularity in various domains, helping users discover meaningful information from complex and large data sets. Users often face difficulty in disseminating the knowledge discovered without clear recall of their exploration paths and analysis processes. We introduce a visual analysis tool that allows analysts to record reusable and guided analytics from their interaction logs. To capture the analysis process, we use a decision tree whose node embeds visualizations and guide to define a visual analysis task. The tool enables analysts to formalize analysis strategies, build best practices, and guide novices through systematic workflows.
AI Key Findings
Get AI-generated insights about this paper's methodology, results, significance, and more — seven facets brought into focus.
Impact
Paper Details
Authors
PDF Preview
Key Terms
Citation Network
Current paper (gray), citations (green), references (blue)
Display is limited for performance on very large graphs.
Discussion 0