Summary
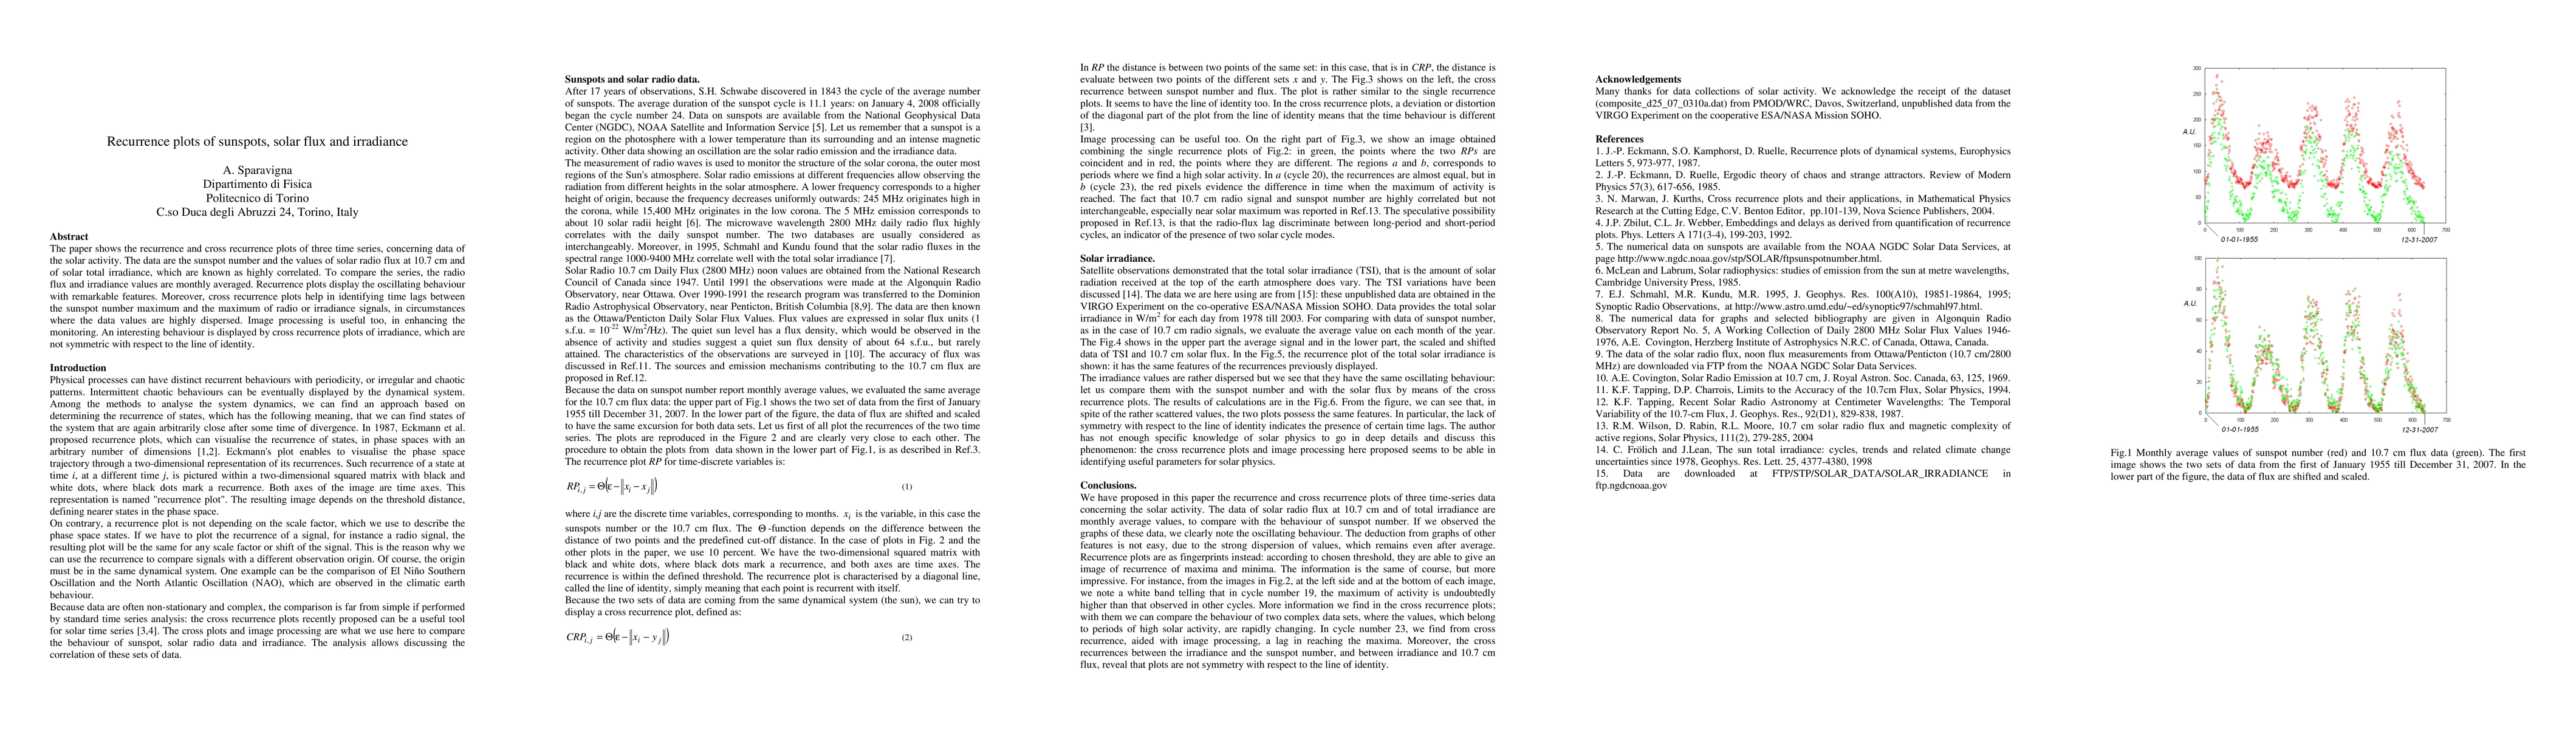
The paper shows the recurrence and cross recurrence plots of three time series, concerning data of the solar activity. The data are the sunspot number and the values of solar radio flux at 10.7 cm and of solar total irradiance, which are known as highly correlated. To compare the series, the radio flux and irradiance values are monthly averaged. Recurrence plots display the oscillating behaviour with remarkable features. Moreover, cross recurrence plots help in identifying time lags between the sunspot number maximum and the maximum of radio or irradiance signals, in circumstances where the data values are highly dispersed. Image processing is useful too, in enhancing the monitoring. An interesting behaviour is displayed by cross recurrence plots of irradiance, which are not symmetric with respect to the line of identity.
AI Key Findings
Get AI-generated insights about this paper's methodology, results, and significance.
Paper Details
PDF Preview
Key Terms
Citation Network
Current paper (gray), citations (green), references (blue)
Display is limited for performance on very large graphs.
Similar Papers
Found 4 papers| Title | Authors | Year | Actions |
|---|
Comments (0)