Red and Blueshifts in Multi-stranded Coronal Loops: A New Temperature Diagnostic
Publication
Metrics
AI Quick Summary
This study reveals a broad distribution of blue and red Dopplershifts in coronal loops observed by Hinode's EIS, indicating plasma condensation and evaporation. A new temperature diagnostic is derived from the average Dopplershift, estimating the mean plasma temperature at loop footpoints and along the loop.
Paper Preview
Abstract
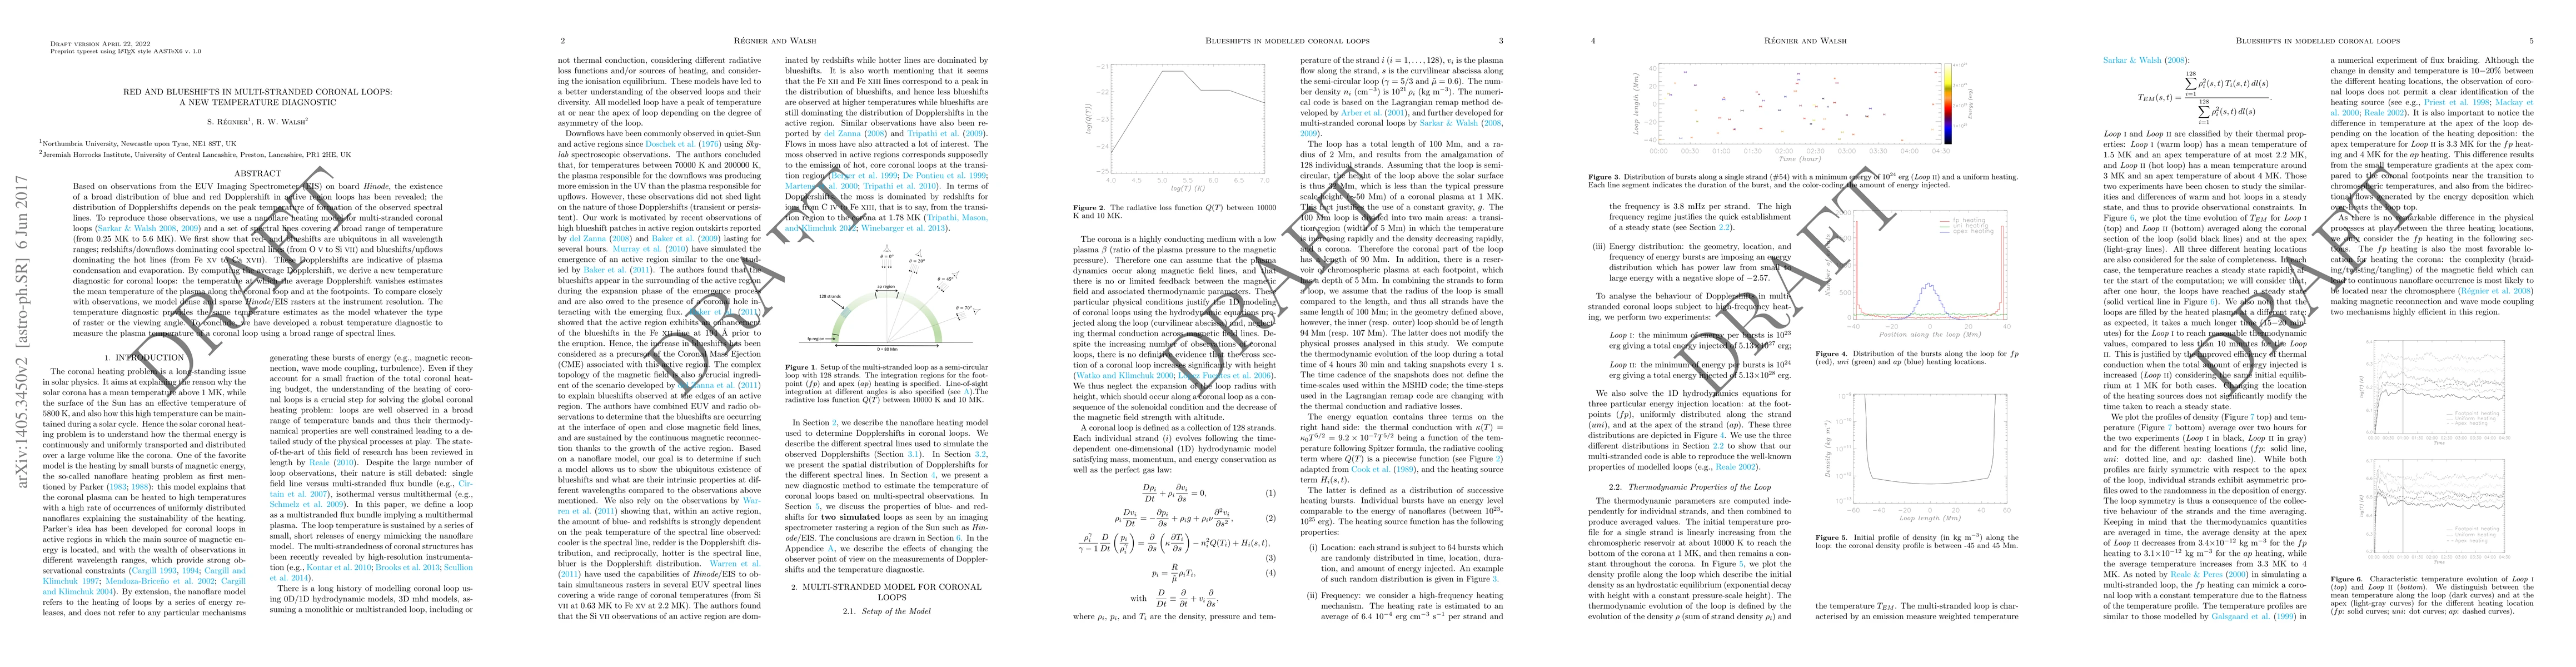
Based on observations from the EUV Imaging Spectrometer (EIS) on board Hinode, the existence of a broad distribution of blue and red Dopplershift in active region loops has been revealed; the distribution of Dopplershifts depends on the peak temperature of formation of the observed spectral lines. To reproduce those observations, we use a nanoflare heating model for multi-stranded coronal loops (Sarkar and Walsh 2008, 2009) and a set of spectral lines covering a broad range of temperature (from 0.25 MK to 5.6 MK). We first show that red- and blueshifts are ubiquitous in all wavelength ranges; redshifts/downflows dominating cool spectral lines (from O V to Si VII) and blueshifts/upflows dominating the hot lines (from Fe XV to Ca XVII). These Dopplershifts are indicative of plasma condensation and evaporation. By computing the average Dopplershift, we derive a new temperature diagnostic for coronal loops: the temperature at which the average Dopplershift vanishes estimates the mean temperature of the plasma along the coronal loop and at the footpoints. To compare closely with observations, we model dense and sparse Hinode/EIS rasters at the instrument resolution. The temperature diagnostic provides the same temperature estimates as the model whatever the type of raster or the viewing angle. To conclude, we have developed a robust temperature diagnostic to measure the plasma temperature of a coronal loop using a broad range of spectral lines.
AI Key Findings
Get AI-generated insights about this paper's methodology, results, significance, and more — seven facets brought into focus.
Impact
Paper Details
PDF Preview
Key Terms
Citation Network
Current paper (gray), citations (green), references (blue)
Display is limited for performance on very large graphs.
Discussion 0