Summary
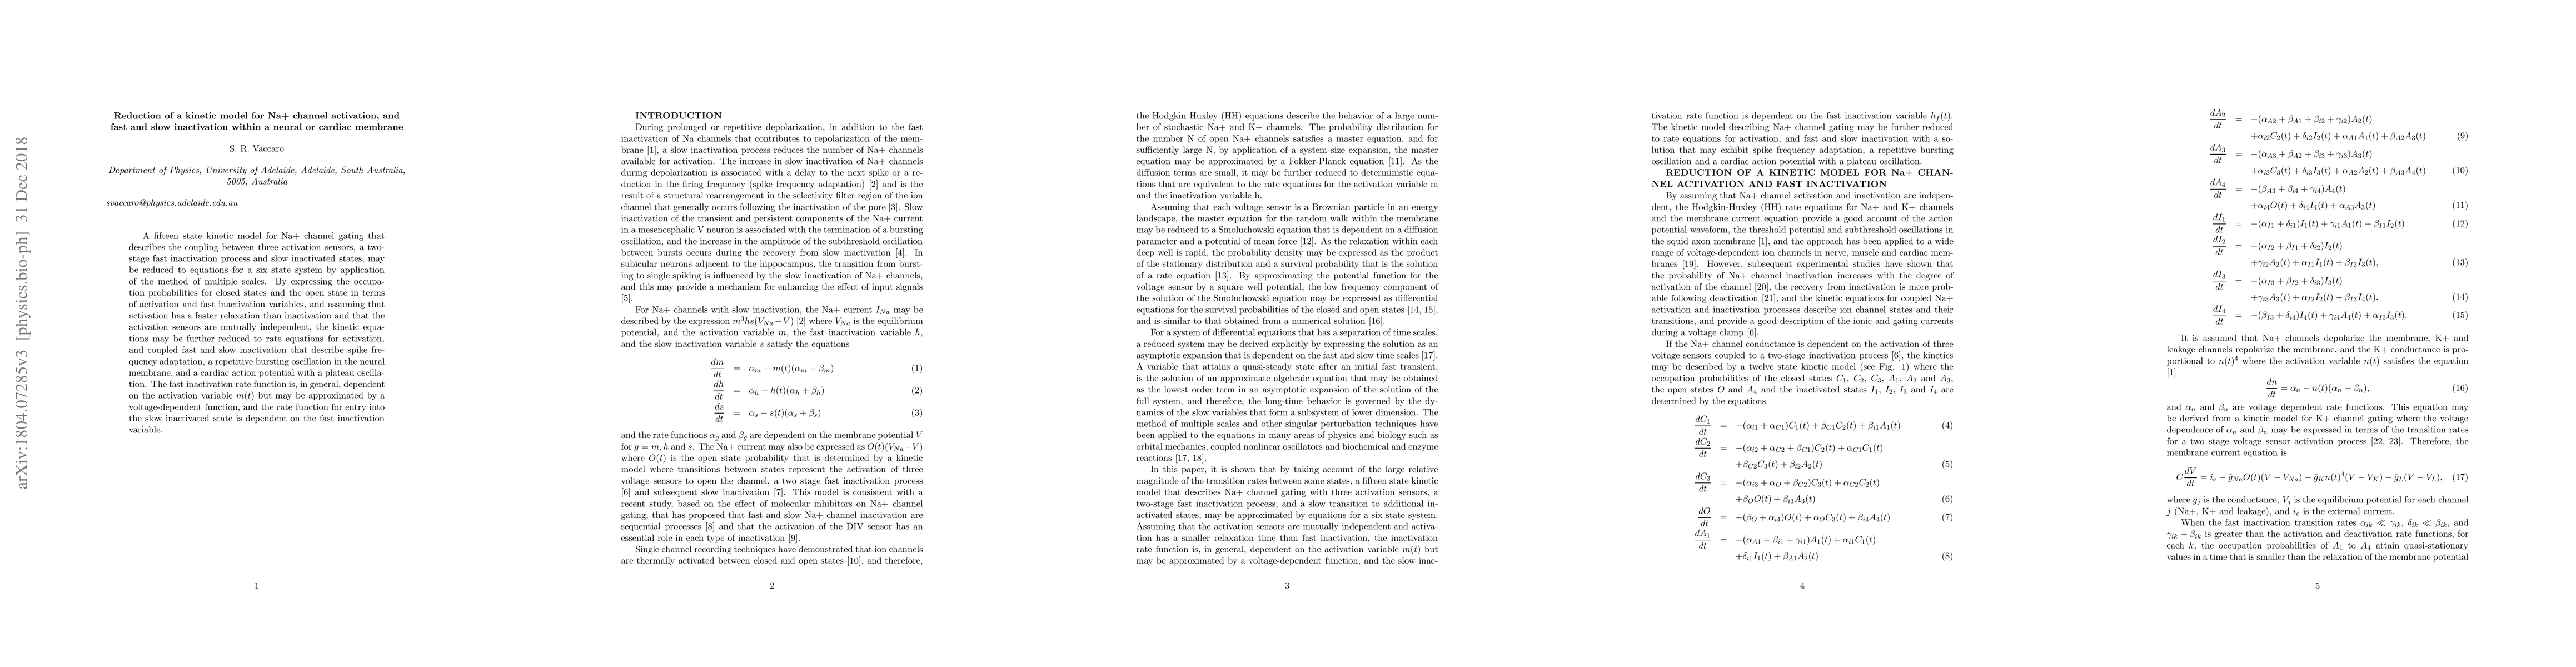
A fifteen state kinetic model for Na+ channel gating that describes the coupling between three activation sensors, a two-stage fast inactivation process and slow inactivated states, may be reduced to equations for a six state system by application of the method of multiple scales. By expressing the occupation probabilities for closed states and the open state in terms of activation and fast inactivation variables, and assuming that activation has a faster relaxation than inactivation and that the activation sensors are mutually independent, the kinetic equations may be further reduced to rate equations for activation, and coupled fast and slow inactivation that describe spike frequency adaptation, a repetitive bursting oscillation in the neural membrane, and a cardiac action potential with a plateau oscillation. The fast inactivation rate function is, in general, dependent on the activation variable m(t) but may be approximated by a voltage-dependent function, and the rate function for entry into the slow inactivated state is dependent on the fast inactivation variable.
AI Key Findings
Get AI-generated insights about this paper's methodology, results, and significance.
Paper Details
PDF Preview
Key Terms
Citation Network
Current paper (gray), citations (green), references (blue)
Display is limited for performance on very large graphs.
Similar Papers
Found 4 papersDepolarization block induction via slow NaV1.1 inactivation in Dravet syndrome
Serafim Rodrigues, Mathieu Desroches, Fabien Campillo et al.
No citations found for this paper.
Comments (0)