Refining the Optimization Target for Automatic Univariate Time Series Anomaly Detection in Monitoring Services
Publication
Metrics
AI Quick Summary
This paper proposes a framework for automating parameter optimization in time series anomaly detection, introducing three optimization targets: prediction, shape, and sensitivity scores. The framework requires minimal user input and has been successfully deployed online, demonstrating its effectiveness through extensive evaluations.
Paper Preview
Abstract
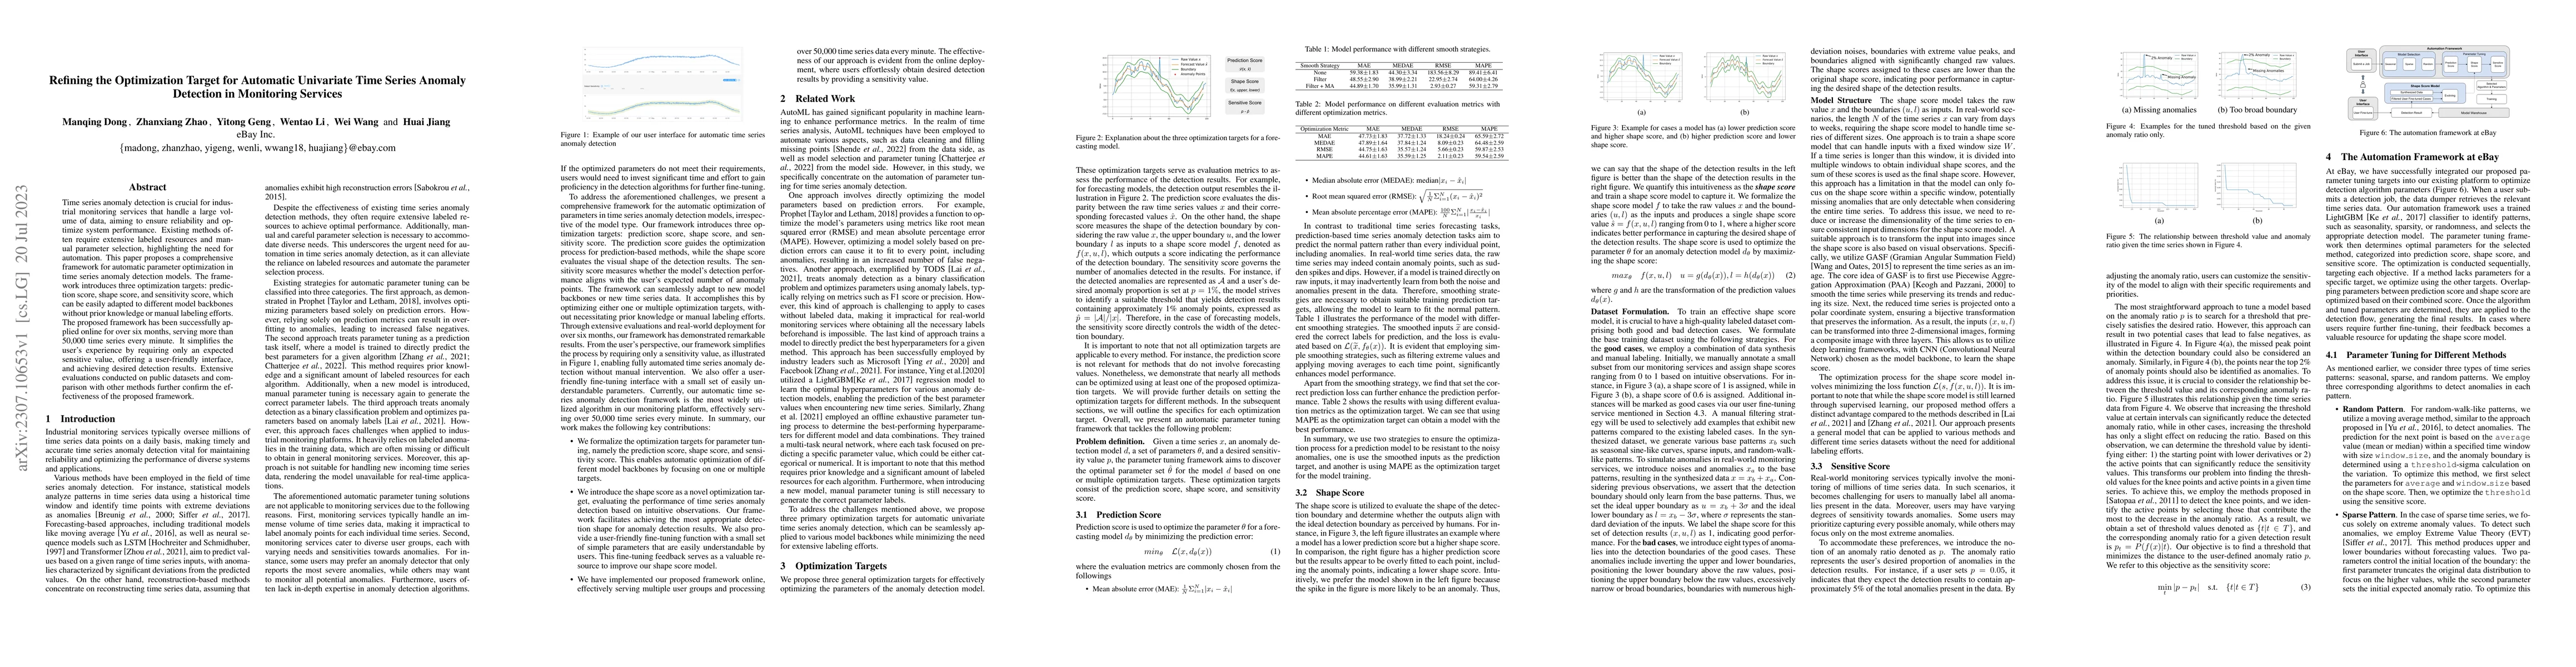
Time series anomaly detection is crucial for industrial monitoring services that handle a large volume of data, aiming to ensure reliability and optimize system performance. Existing methods often require extensive labeled resources and manual parameter selection, highlighting the need for automation. This paper proposes a comprehensive framework for automatic parameter optimization in time series anomaly detection models. The framework introduces three optimization targets: prediction score, shape score, and sensitivity score, which can be easily adapted to different model backbones without prior knowledge or manual labeling efforts. The proposed framework has been successfully applied online for over six months, serving more than 50,000 time series every minute. It simplifies the user's experience by requiring only an expected sensitive value, offering a user-friendly interface, and achieving desired detection results. Extensive evaluations conducted on public datasets and comparison with other methods further confirm the effectiveness of the proposed framework.
AI Key Findings
Get AI-generated insights about this paper's methodology, results, significance, and more — seven facets brought into focus.
Impact
Paper Details
Authors
PDF Preview
Key Terms
Citation Network
Current paper (gray), citations (green), references (blue)
Display is limited for performance on very large graphs.
Discussion 0