Background
The study sits at the intersection of cognitive science, human-computer interaction, and marketing research. It builds on ideas about reflection and constructive perception, where diagrams and visual tools help people become aware of their present perception and rethink it. Prior work in marketing includes conjoint analysis, hierarchical Bayes modeling, and latent-class approaches that seek to uncover latent factors in consumer demand, but these methods are typically unable to discover unknown factors that underlie unconscious preferences. The authors leverage ideas from diagrammatic reasoning and network visualization to create tools that reveal not only explicit likes but also the structure and entry points into clusters of preference. The method also draws on precedents in group discussion and reflection as a way to turn internal states into communicable knowledge.
Problem / Research Question
The central challenge addressed is how to help individuals become aware of unconscious preferences and articulate them to others. The authors ask whether a practical tool that combines reflective discussion with visualization can reveal weak, unconscious preferences that conventional methods miss. They also investigate whether introducing an adjustable parameter into visualization can compensate for individual differences in how people interpret and verbalize their preferences, thereby improving mutual understanding in group settings.
Innovation / Contribution
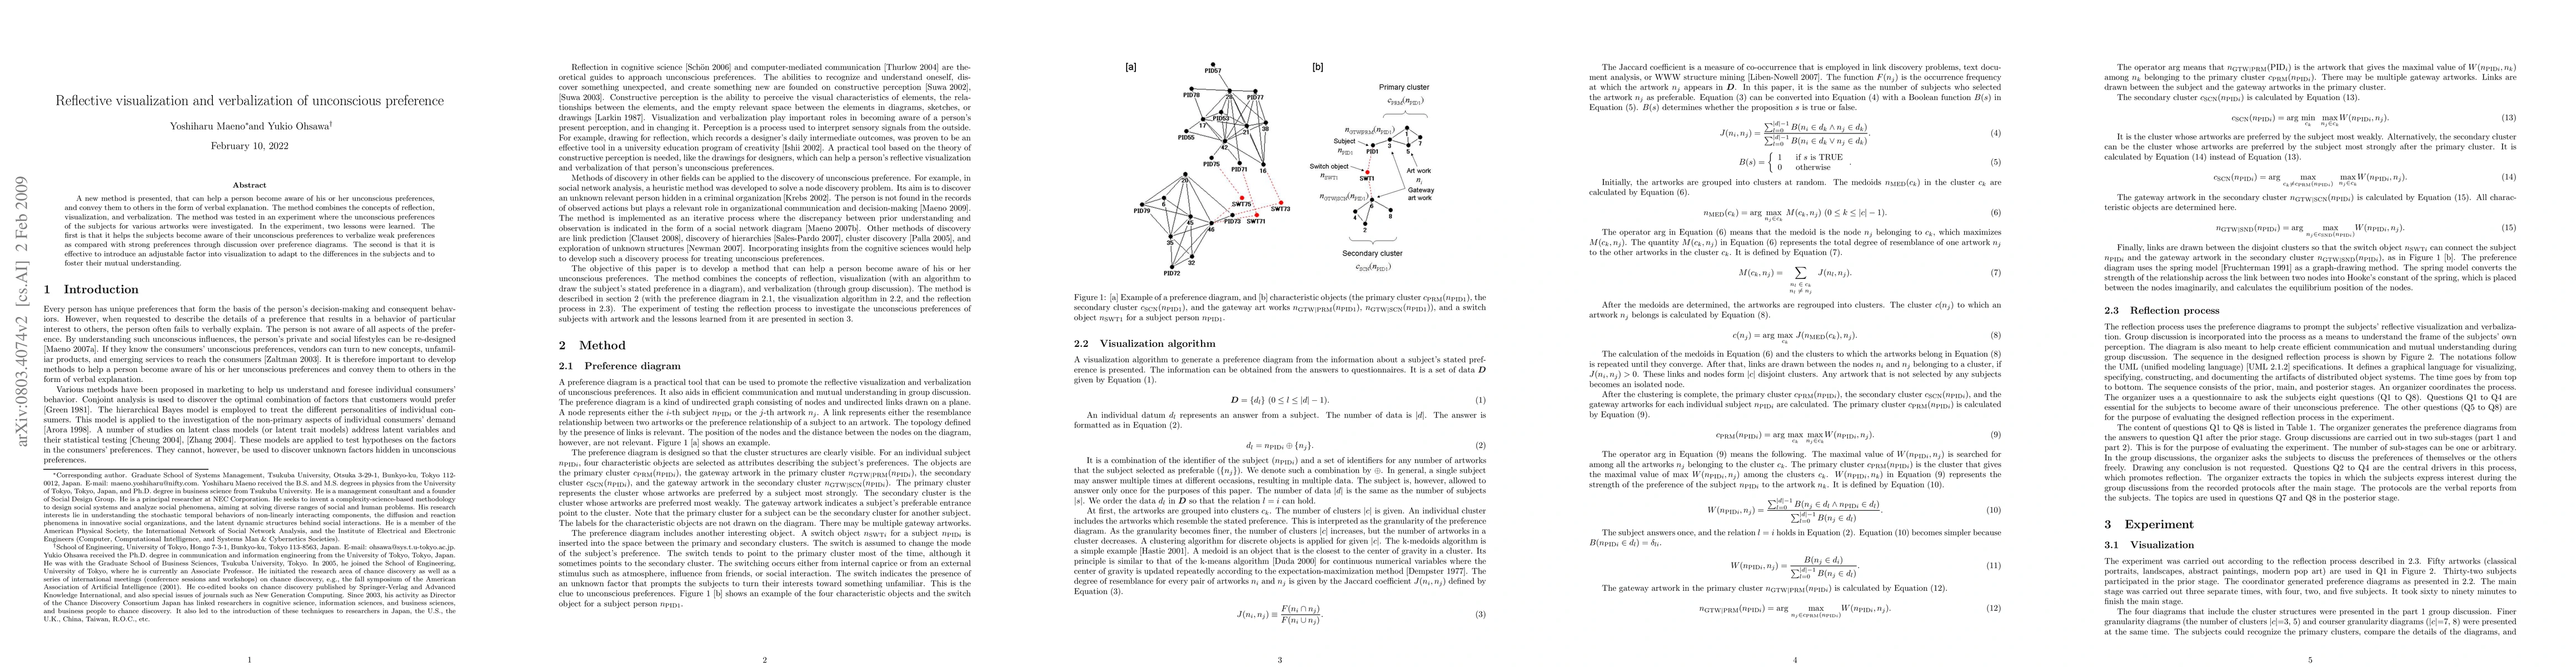
The paper presents a cohesive framework that integrates three components: reflection, visualization, and verbalization. The core innovation is the preference diagram, an undirected graph that maps subjects and artworks into clusters and encodes relationships such as resemblance between artworks and a subject's preference for an artwork. Four characteristic objects for each subject are identified: the primary cluster (strongest preferences), its gateway artwork, the secondary cluster (weakest preferences), and its gateway artwork. A switch object between clusters captures the tendency to shift attention toward unfamiliar items, providing a concrete representation of unconscious influence. The visualization is generated via a k-medoids clustering of artworks, using the Jaccard coefficient to measure resemblance, followed by a graph drawing based on a spring-model layout. The reflection process then uses a sequence of questions and group discussions to extract topics and verbalizations related to unconscious preferences.
Methodology / Approach
Data are collected as a set D of individual responses to a questionnaire about artworks. The artworks are clustered into a predefined number of clusters using a discrete clustering algorithm (eg, k-medoids). The similarity between artworks is captured by the Jaccard coefficient, computed from artwork co-occurrence across subjects. Medoids are iteratively refined, and clusters are redefined until convergence. For each subject, the primary cluster is chosen as the cluster that maximizes the perceived strength of preference, defined by a weight W between the subject and artworks. The gateway artworks are identified as the strongest links into the primary or secondary clusters, and a switch object is placed between the clusters to reflect potential shifts in preference. The final layout uses a spring-model graph drawing to position nodes so that stronger relations correspond to tighter couplings.
The reflection process operates in a three-stage sequence with an organizer coordinating eight questions. Q1 to Q4 are designed to surface unconscious characteristics, while Q5 to Q8 evaluate the usefulness and impact of the diagrams and the topics arising in group discussions. In part I the group discusses coarse-grained diagrams to identify major cluster structures; in part II finer diagrams are used to reveal the origins of weak preferences and to interpret the switch objects. The content of the discussions and the topics extracted from protocols are then analyzed to understand what participants became aware of and how the diagrams supported understanding.
Experiments / Evaluation
The experiment engages fifty artworks across several genres and involves thirty-two subjects in the prior stage, with the main reflection stage conducted in three separate runs (four, two, and five subjects). The main stage included both coarse and fine granularity diagrams, presented in parallel to allow subjects to compare different granularities. The time investment ranged from sixty to ninety minutes for the main stage. In the first part, participants discuss the cluster structures and interpret the diagrams; in the second part, they examine the switch objects and the secondary clusters to glean insights into unconscious preferences.
Two analyses are reported. The first evaluates the usefulness of the diagrams using questions about their usefulness in the two parts of discussion (Q5 and Q6). The second analyzes the topics that helped subjects verify or become aware of their preferences (Q7 and Q8). The protocol analysis yields nine topics with T3, T2, and T1 as the most relevant for verification, and T8, T9, and T7 highlighting the role of the secondary clusters and switch objects in awareness. The results suggest that the diagrams are broadly useful, particularly in part II when the switch and secondary clusters are interpreted, and that granularity can influence what subjects notice.
Key Results
The authors report two main lessons. First, verbalizing weak preferences becomes more feasible when discussed within the context of preference diagrams, especially through comparing weak and strong preferences. Second, an adjustable visualization granularity is effective for accommodating individual differences and fostering mutual understanding during group discussion. The results also indicate that the content of unconscious preferences depends on the presented artworks and the participants, implying that the interpretation of weak preferences is context-sensitive.
Practical Applications
The method offers a practical toolkit for marketing, education, and communication research. By surfacing unconscious tendencies through reflective visualization, organizations can gain richer, more nuanced consumer insights, tailor interventions to individual differences, and facilitate clearer conversations about preferences within groups. The adjustable granularity feature provides a way to personalize the visualization to different populations and contexts, potentially improving the interpretability and acceptance of insights derived from unconscious preferences.
Limitations & Considerations
The study is exploratory and context-specific, focusing on artworks as the target domain. Generalization to other domains or cultures remains to be tested. The approach relies on subjective self-reports, group discussion dynamics, and environment-driven effects, which may bias the identification and interpretation of unconscious preferences. The clustering and graph-drawing steps involve parameters such as the number of clusters and the granularity, whose selection can materially affect results; systematic guidelines or automated methods for parameter choice are not fully developed. Finally, while the method emphasizes uncovering unconscious tendencies, it does not establish external validity or causal links to behavior outside the experimental setting, and future work should address longitudinal stability and cross-domain applicability.
Discussion 0