Regional Inequality Simulations Based on Asset Exchange Models with Exchange Range and Local Support Bias
Publication
Metrics
AI Quick Summary
This paper proposes new regional asset exchange models to simulate regional inequality, incorporating spatial exchange range and local support bias. Simulations indicate that reducing regional inequality requires increasing intra-regional economic activity, narrowing inter-regional exchange zones, and applying local support bias, which together shift asset distribution towards a more equitable normal distribution.
Paper Preview
Abstract
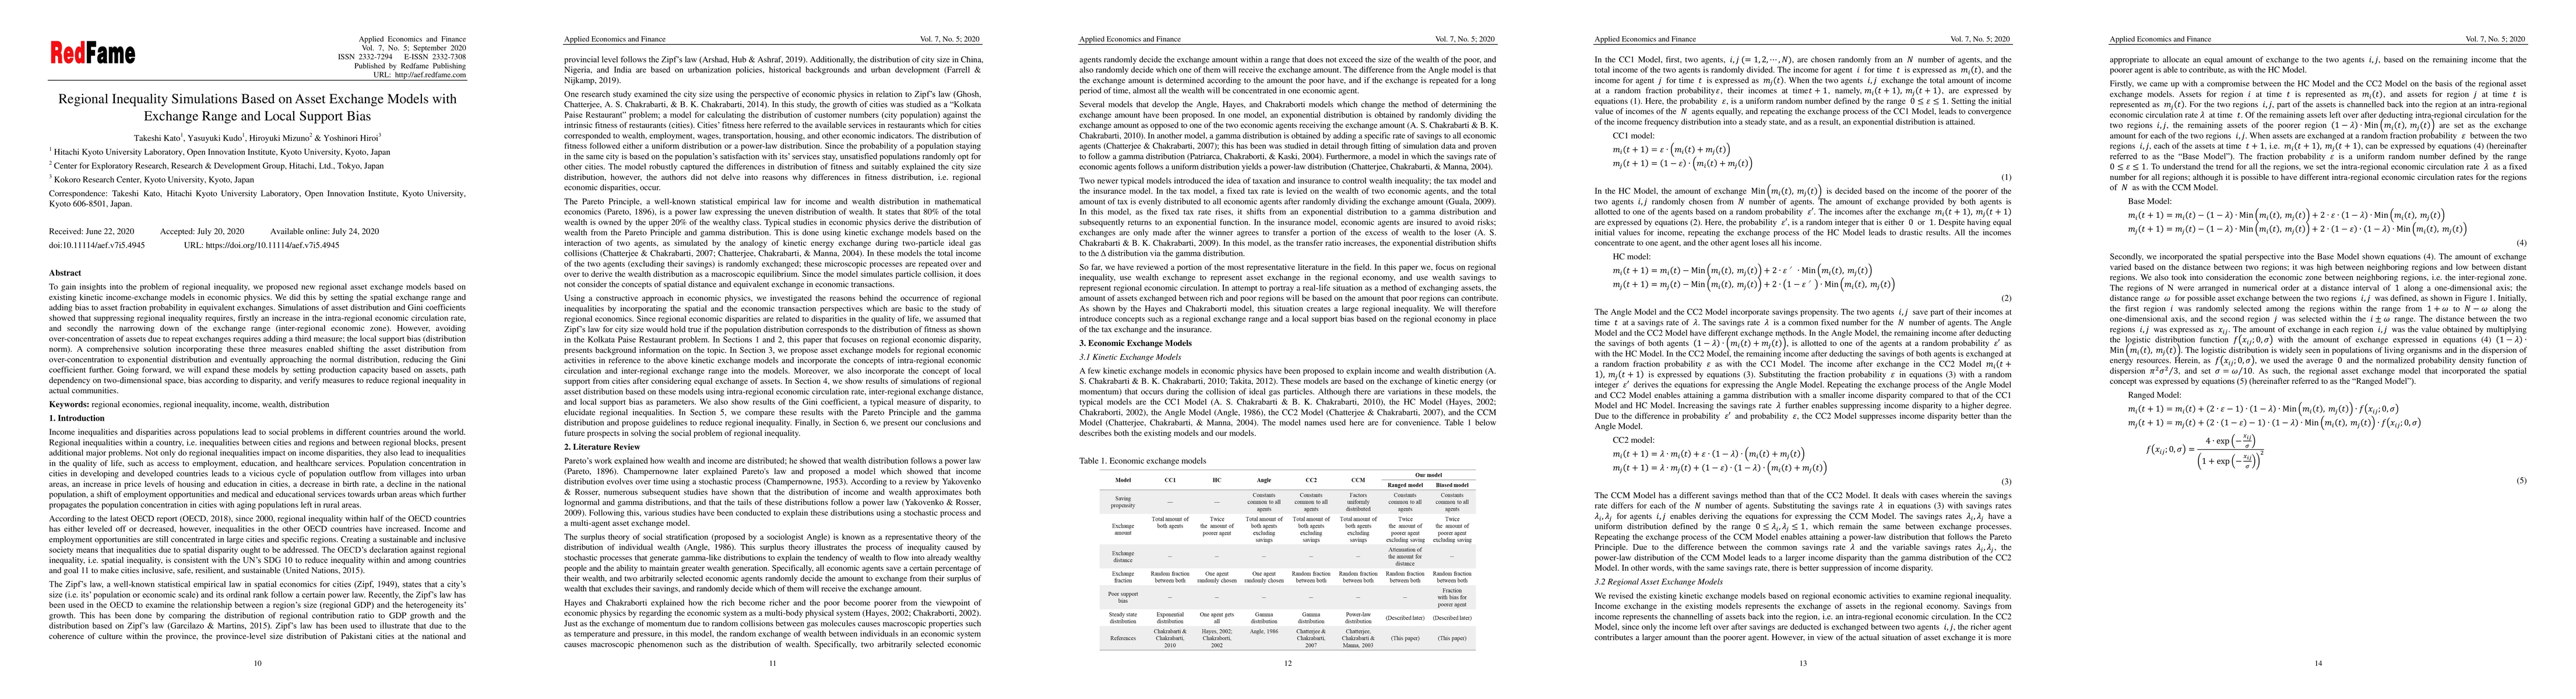
To gain insights into the problem of regional inequality, we proposed new regional asset exchange models based on existing kinetic income-exchange models in economic physics. We did this by setting the spatial exchange range and adding bias to asset fraction probability in equivalent exchanges. Simulations of asset distribution and Gini coefficients showed that suppressing regional inequality requires, firstly an increase in the intra-regional economic circulation rate, and secondly the narrowing down of the exchange range (inter-regional economic zone). However, avoiding over-concentration of assets due to repeat exchanges requires adding a third measure; the local support bias (distribution norm). A comprehensive solution incorporating these three measures enabled shifting the asset distribution from over-concentration to exponential distribution and eventually approaching the normal distribution, reducing the Gini coefficient further. Going forward, we will expand these models by setting production capacity based on assets, path dependency on two-dimensional space, bias according to disparity, and verify measures to reduce regional inequality in actual communities.
AI Key Findings
Get AI-generated insights about this paper's methodology, results, significance, and more — seven facets brought into focus.
Impact
Paper Details
PDF Preview
Key Terms
Citation Network
Current paper (gray), citations (green), references (blue)
Display is limited for performance on very large graphs.
Discussion 0