RemixTape is an application designed to construct structured narratives around quantitative metrics by semantically aligning and annotating juxtaposed charts and text, and recommending complementary charts. Participants found it beneficial for discussing metrics compared to traditional visualization methods.
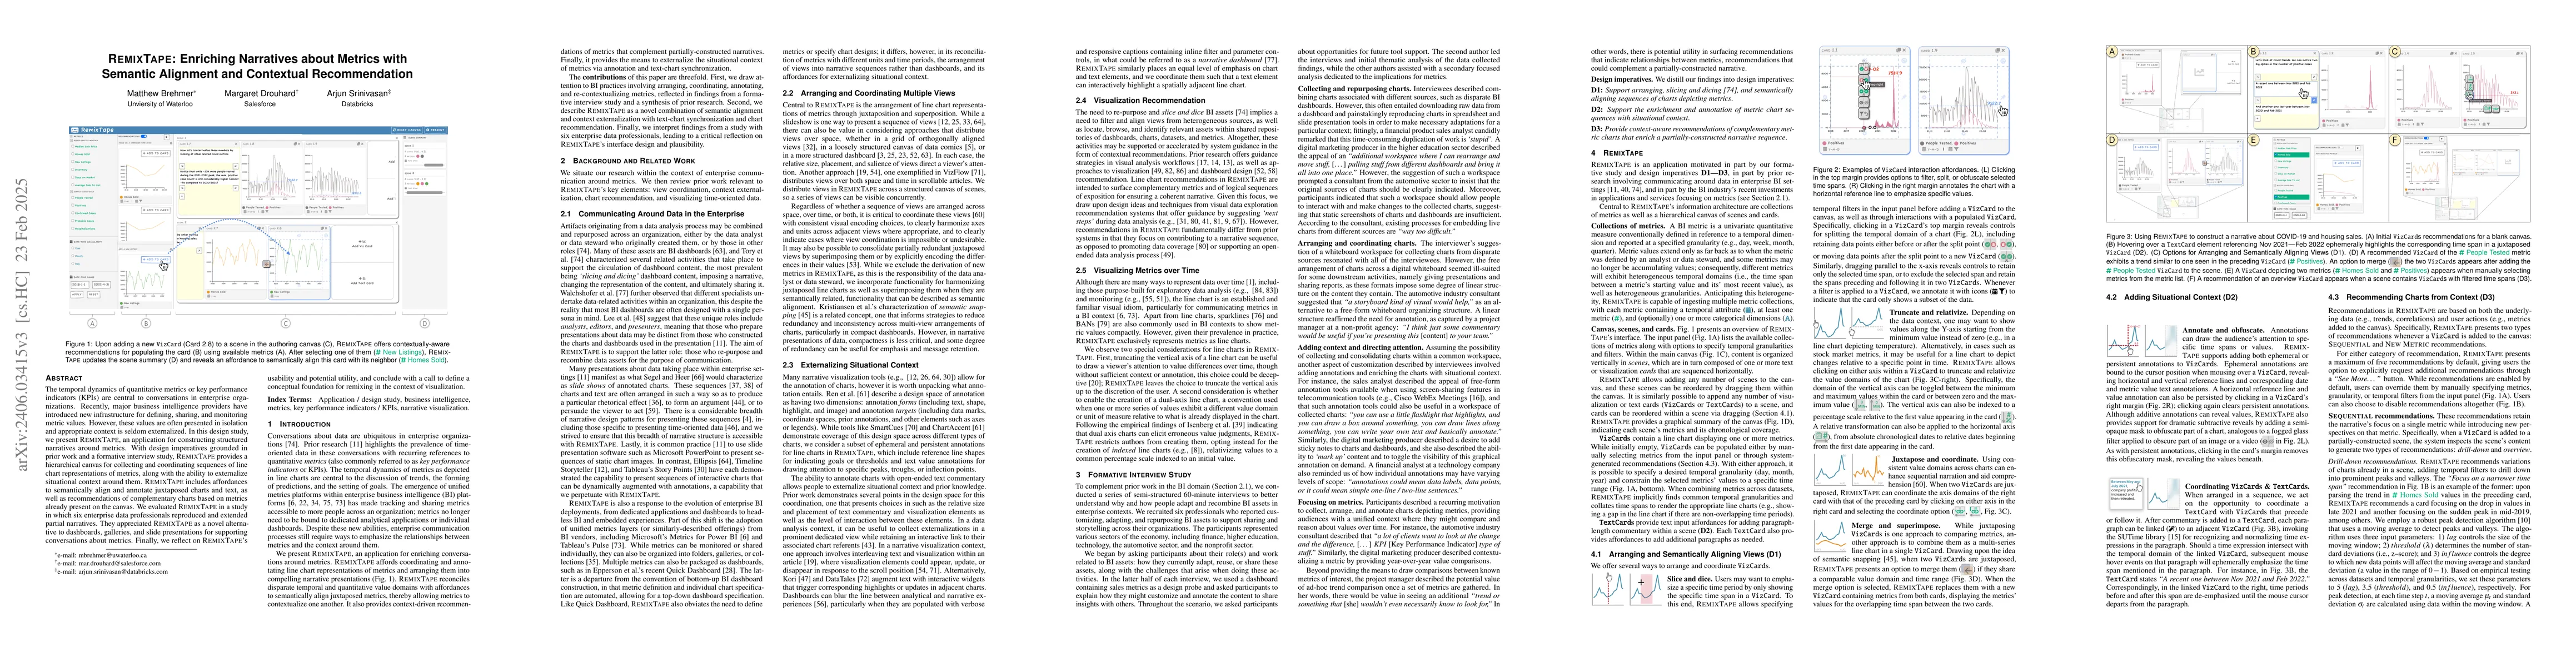
The temporal dynamics of quantitative metrics or key performance indicators (KPIs) are central to decision making within enterprise organizations. Recently, major business intelligence providers have introduced new infrastructure for defining, sharing, and monitoring metric values. However, these values are often presented in isolation and appropriate context is seldom externalized. In this design study, we present RemixTape, an application for constructing structured narratives around metrics. With design imperatives grounded in an formative interview study, RemixTape provides a hierarchical canvas for collecting and coordinating sequences of line chart representations of metrics, along with the ability to externalize situational context around them. RemixTape incorporates affordances to semantically align and annotate juxtaposed charts and text, as well as recommendations of complementary charts based on metrics already present on the canvas. We evaluated RemixTape in a user study in which six enterprise data professionals reproduced and extended partial narratives, with participants appreciating RemixTape as a novel alternative to dashboards, galleries, and slide presentations for supporting conversations about metrics. We conclude with a reflection on how aspects of RemixTape could generalize beyond metrics, with a call to define a conceptual foundation for remixing in the context of visualization.
This graph shows how this paper is connected to other research. The current paper is shown in dark gray, papers that cite it are in green, and papers it references are in blue. You can:
• Hover over any node to see the paper title
• Click a node to view that paper's details
• Drag nodes to rearrange the graph
• Use the zoom controls (bottom right) to zoom in/out
No citations found for this paper.
Title | Authors | Year | Actions |
---|---|---|---|
SlopeSeeker: A Search Tool for Exploring a Dataset of Quantifiable Trends
|
Alexander Bendeck, Dennis Bromley, V. Setlur
|
2024
|
View Paper |
Transitioning to a Commercial Dashboarding System: Socio-Technical Observations and Opportunities
|
C. Walchshofer, Vaishali Dhanoa, Marc Streit, Miriah Meyer
|
2023
|
View Paper |
A Declarative Specification for Authoring Metrics Dashboards
|
Will Epperson, Kanit Wongsuphasawat, Allison Whilden, Fan Du, Justin Talbot
|
2023
|
View Paper |
DATATALES: Investigating the use of Large Language Models for Authoring Data-Driven Articles
|
N. Sultanum, Arjun Srinivasan
|
2023
|
View Paper |
DMiner: Dashboard Design Mining and Recommendation
|
Yanna Lin, Haotian Li, Aoyu Wu, Yong Wang, Huamin Qu
|
2022
|
View Paper |
M: Intent-based Recommendations to Support Dashboard Composition
|
Aditeya Pandey, Arjun Srinivasan, V. Setlur
|
2022
|
View Paper |
Dashboard Design Patterns
|
B. Bach, Euan Freeman, Alfie Abdul-Rahman, C. Turkay, Saiful Khan, Yulei Fan, Min Chen
|
2022
|
View Paper |
Revisiting the Design Patterns of Composite Visualizations
|
Dazhen Deng, Weiwei Cui, Xiyu Meng, Mengye Xu, Yu Liao, Haidong Zhang, Yingcai Wu
|
2022
|
View Paper |
Finding Their Data Voice: Practices and Challenges of Dashboard Users
|
Melanie Tory, L. Bartram, Brittany Fiore-Gartland, Anamaria Crisan
|
2021
|
View Paper |
Semantic Snapping for Guided Multi-View Visualization Design
|
Y. S. Kristiansen, L. Garrison, S. Bruckner
|
2021
|
View Paper |
Kori: Interactive Synthesis of Text and Charts in Data Documents
|
Shahid Latif, Zhengzhong Zhou, Yoon Kim, Fabian Beck, N. Kim
|
2021
|
View Paper |
From Jam Session to Recital: Synchronous Communication and Collaboration Around Data in Organizations
|
M. Brehmer, Robert Kosara
|
2021
|
View Paper |
Leveraging Text-Chart Links to Support Authoring of Data-Driven Articles with VizFlow
|
N. Sultanum, Fanny Chevalier, Z. Bylinskii, Zhicheng Liu
|
2021
|
View Paper |
Understanding Narrative Linearity for Telling Expressive Time-Oriented Stories
|
Xingyu Lan, Xinyue Xu, Nan Cao
|
2021
|
View Paper |
The Unmet Data Visualization Needs of Decision Makers Within Organizations
|
Evanthia Dimara, Harry Zhang, Melanie Tory, S. Franconeri
|
2021
|
View Paper |
Deconstructing Categorization in Visualization Recommendation: A Taxonomy and Comparative Study
|
D. Lee, V. Setlur, Melanie Tory, Karrie Karahalios, Aditya G. Parameswaran
|
2021
|
View Paper |
AI4VIS: Survey on Artificial Intelligence Approaches for Data Visualization
|
Aoyu Wu, Yun Wang, Xinhuan Shu, Dominik Moritz, Weiwei Cui, Haidong Zhang, Dongmei Zhang, Huamin Qu
|
2021
|
View Paper |
Comparative Layouts Revisited: Design Space, Guidelines, and Future Directions
|
S. L’Yi, Jaemin Jo, Jinwook Seo
|
2020
|
View Paper |
A survey on automatic infographics and visualization recommendations
|
Sujia Zhu, Guodao Sun, Qi Jiang, Meng Zha, Ronghua Liang
|
2020
|
View Paper |
QualDash: Adaptable Generation of Visualisation Dashboards for Healthcare Quality Improvement
|
Mai Elshehaly, R. Randell, M. Brehmer, Lynn Mcvey, Natasha Alvarado, C. Gale, R. Ruddle
|
2020
|
View Paper |
Dziban: Balancing Agency & Automation in Visualization Design via Anchored Recommendations
|
Halden Lin, Dominik Moritz, Jeffrey Heer
|
2020
|
View Paper |
DataShot: Automatic Generation of Fact Sheets from Tabular Data
|
Yun Wang, Zhida Sun, Haidong Zhang, Weiwei Cui, Ke Xu, Xiaojuan Ma, Dongmei Zhang
|
2020
|
View Paper |
Inking Your Insights: Investigating Digital Externalization Behaviors During Data Analysis
|
Yea-Seul Kim, N. Riche, Bongshin Lee, M. Brehmer, M. Pahud, K. Hinckley, J. Hullman
|
2019
|
View Paper |
Critical Reflections on Visualization Authoring Systems
|
Arvind Satyanarayan, Bongshin Lee, Donghao Ren, Jeffrey Heer, J. Stasko, John Thompson, M. Brehmer, Zhicheng Liu
|
2019
|
View Paper |
Criteria for Rigor in Visualization Design Study
|
Miriah D. Meyer, J. Dykes
|
2019
|
View Paper |
Truncating the Y-Axis: Threat or Menace?
|
M. Correll, E. Bertini, S. Franconeri
|
2019
|
View Paper |
A Review of Guidance Approaches in Visual Data Analysis: A Multifocal Perspective
|
D. Ceneda, T. Gschwandtner, S. Miksch
|
2019
|
View Paper |
Keeping Multiple Views Consistent: Constraints, Validations, and Exceptions in Visualization Authoring
|
Zening Qu, J. Hullman
|
2019
|
View Paper |
Understanding Partitioning and Sequence in Data-Driven Storytelling
|
Zhenpeng Zhao, R. Marr, Jason Shaffer, N. Elmqvist
|
2019
|
View Paper |
Augmenting Visualizations with Interactive Data Facts to Facilitate Interpretation and Communication
|
Arjun Srinivasan, S. Drucker, A. Endert, J. Stasko
|
2019
|
View Paper |
What Do We Talk About When We Talk About Dashboards?
|
Alper Sarıkaya, M. Correll, L. Bartram, Melanie Tory, Danyel Fisher
|
2019
|
View Paper |
SmartCues: A Multitouch Query Approach for Details-on-Demand through Dynamically Computed Overlays
|
Hariharan Subramonyam, Eytan Adar
|
2019
|
View Paper |
Timeline Storyteller: The Design & Deployment of an Interactive Authoring Tool for Expressive Timeline Narratives
|
M. Brehmer, Bongshin Lee, N. Riche, D. Tittsworth, Kate Lytvynets, D. Edge, Christopher M. White
|
2018
|
View Paper |
Idyll: A Markup Language for Authoring and Publishing Interactive Articles on the Web
|
Matthew Conlen, Jeffrey Heer
|
2018
|
View Paper |
Guidance in the human-machine analytics process
|
C. Collins, N. Andrienko, Tobias Schreck, J. Yang, J. Choo, U. Engelke, Amit Jena, Tim Dwyer
|
2018
|
View Paper |
Reflecting on the Evaluation of Visualization Authoring Systems : Position Paper
|
Donghao Ren, Bongshin Lee, M. Brehmer, N. Riche
|
2018
|
View Paper |
How Social Dynamics and the Context of Digital Content Impact Workplace Remix
|
Jessica L. Feuston, Siân E. Lindley
|
2018
|
View Paper |
Design Patterns for Data Comics
|
Benjamin Bach, Zezhong Wang, Matteo Farinella, Dave Murray-Rust, N. Riche
|
2018
|
View Paper |
Evaluating Data-Driven Stories and Storytelling Tools *
|
Fereshteh Amini, M. Brehmer, G. Bolduan, Christine Elmer, B. Wiederkehr
|
2018
|
View Paper |
DataSite: Proactive visual data exploration with computation of insight-based recommendations
|
Zhe Cui, Sriram Karthik Badam, Adil Yalçin, N. Elmqvist
|
2018
|
View Paper |
Finding a Clear Path: Structuring Strategies for Visualization Sequences
|
J. Hullman, Robert Kosara, Heidi Lam
|
2017
|
View Paper |
Visual Narrative Flow: Exploring Factors Shaping Data Visualization Story Reading Experiences
|
Sean McKenna, N. Riche, Bongshin Lee, Jeremy Boy, Miriah D. Meyer
|
2017
|
View Paper |
GraphScape: A Model for Automated Reasoning about Visualization Similarity and Sequencing
|
Younghoon Kim, Kanit Wongsuphasawat, J. Hullman, Jeffrey Heer
|
2017
|
View Paper |
Voyager 2: Augmenting Visual Analysis with Partial View Specifications
|
Kanit Wongsuphasawat, Zening Qu, Dominik Moritz, Riley Chang, Felix Ouk, Anushka Anand, J. Mackinlay, Bill Howe, Jeffrey Heer
|
2017
|
View Paper |
ChartAccent: Annotation for data-driven storytelling
|
Donghao Ren, M. Brehmer, Bongshin Lee, Tobias Höllerer, E. Choe
|
2017
|
View Paper |
VizAssist: an interactive user assistant for visual data mining
|
F. Bouali, A. Guettala, G. Venturini
|
2016
|
View Paper |
From Visual Exploration to Storytelling and Back Again
|
S. Gratzl, A. Lex, Nils Gehlenborg, Nicola Cosgrove, M. Streit
|
2016
|
View Paper |
Effortless Data Exploration with zenvisage: An Expressive and Interactive Visual Analytics System
|
Tarique Siddiqui, Albert Kim, John Lee, Karrie Karahalios, Aditya G. Parameswaran
|
2016
|
View Paper |
Voyager: Exploratory Analysis via Faceted Browsing of Visualization Recommendations
|
Kanit Wongsuphasawat, Dominik Moritz, Anushka Anand, J. Mackinlay, Bill Howe, Jeffrey Heer
|
2016
|
View Paper |
More Than Telling a Story: Transforming Data into Visually Shared Stories
|
Bongshin Lee, N. Riche, Petra Isenberg, Sheelagh Carpendale
|
2015
|
View Paper |
Domino: Extracting, Comparing, and Manipulating Subsets Across Multiple Tabular Datasets
|
S. Gratzl, Nils Gehlenborg, A. Lex, H. Pfister, M. Streit
|
2014
|
View Paper |
The Persuasive Power of Data Visualization
|
Anshul Vikram Pandey, A. Manivannan, O. Nov, Margaret L. Satterthwaite, E. Bertini
|
2014
|
View Paper |
Authoring Narrative Visualizations with Ellipsis
|
Arvind Satyanarayan, Jeffrey Heer
|
2014
|
View Paper |
A Deeper Understanding of Sequence in Narrative Visualization
|
J. Hullman, S. Drucker, N. Riche, Bongshin Lee, Danyel Fisher, Eytan Adar
|
2013
|
View Paper |
Enterprise Data Analysis and Visualization: An Interview Study
|
Sean Kandel, A. Paepcke, J. Hellerstein, Jeffrey Heer
|
2012
|
View Paper |
VizDeck: self-organizing dashboards for visual analytics
|
A. Key, Bill Howe, D. Perry, Cecilia R. Aragon
|
2012
|
View Paper |
Annotating BI visualization dashboards: needs & challenges
|
Micheline Elias, A. Bezerianos
|
2012
|
View Paper |
SUTime: A library for recognizing and normalizing time expressions
|
Angel X. Chang, Christopher D. Manning
|
2012
|
View Paper |
Exploratory Analysis of Time-Series with ChronoLenses
|
J. Zhao, Fanny Chevalier, Emmanuel Pietriga, Ravin Balakrishnan
|
2011
|
View Paper |
Visualization Rhetoric: Framing Effects in Narrative Visualization
|
J. Hullman, N. Diakopoulos
|
2011
|
View Paper |
A Study on Dual-Scale Data Charts
|
Petra Isenberg, A. Bezerianos, Pierre Dragicevic, Jean-Daniel Fekete
|
2011
|
View Paper |
Visualization of Time-Oriented Data
|
W. Aigner, S. Miksch, H. Schumann, C. Tominski
|
2011
|
View Paper |
KronoMiner: using multi-foci navigation for the visual exploration of time-series data
|
Jian Zhao, Fanny Chevalier, Ravin Balakrishnan
|
2011
|
View Paper |
Narrative Visualization: Telling Stories with Data
|
E. Segel, Jeffrey Heer
|
2010
|
View Paper |
Behavior-driven visualization recommendation
|
D. Gotz, Zhen Wen
|
2009
|
View Paper |
LiveRAC: interactive visual exploration of system management time-series data
|
P. McLachlan, T. Munzner, E. Koutsofios, S. North
|
2008
|
View Paper |
VizTree: a Tool for Visually Mining and Monitoring Massive Time Series Databases
|
Jessica Lin, Eamonn J. Keogh, S. Lonardi, J. Lankford, D. Nystrom
|
2004
|
View Paper |
Polaris: a system for query, analysis and visualization of multi-dimensional relational databases
|
Chris Stolte, Diane Tang, P. Hanrahan
|
2000
|
View Paper |
Tune in to use collections, playlists for your data
|
2021
|
||
Line chart, index chart
|
2018
|
||
An Argument Structure for Data Stories
|
Robert Kosara
|
2017
|
View Paper |
Characterizing Guidance in Visual Analytics
|
D. Ceneda, T. Gschwandtner, T. May, S. Miksch, Hans-Jörg Schulz, M. Streit, C. Tominski
|
2017
|
View Paper |
In Praise of BANs (Big-Ass Numbers)
|
2017
|
||
VisJockey : Enriching Data Stories through Orchestrated Interactive Visualization
|
Bum Chul Kwon, Florian Stoffel, Dominik Jäckle, Bongshin Lee, D. Keim
|
2014
|
View Paper |
Build narratives in your dashboards with Story Points in Tableau 8.2
|
2014
|
||
Robust peak detection algorithm using z-scores
|
2014
|
||
Storytelling in Visual Analytics Tools for Business Intelligence
|
Micheline Elias, Marie-Aude Aufaure, A. Bezerianos
|
2013
|
View Paper |
Sparklines
|
2006
|
||
Tableau
|
|||
Goals in Power BI is becoming ‘metrics’ and is moving to GA!, 2022
|
|||
The next layer of the modern data stack, 2022
|
|||
databrain
|
|||
Transform
|
Showing first page preview. Click "Open Full PDF" to view the complete paper.
Eduard Manziuk, Oleksander Barmak, Pavlo Radiuk, Vladislav Kuznetsov, Iurii Krak, Sergiy Yakovlev
Published: 2024-11-28
Chen Wang, Liangwei Yang, Philip S. Yu, Zhiwei Liu, Yueqing Liang, Xiaolong Liu, Mingdai Yang
Published: 2024-02-15
Hao Zhang, Kefan Wang, Mingyue Cheng, Yucong Luo, Qitao Qin, Ruiran Yan, Jie Ouyang
Published: 2024-12-24
Rong Wang, Kun Sun
Published: 2024-10-13
You need to log in to post a comment.
Your comment contains inappropriate language.
Are you sure you want to remove this tag?
Someone just favorited a paper!
Comments (0)