Publication
Metrics
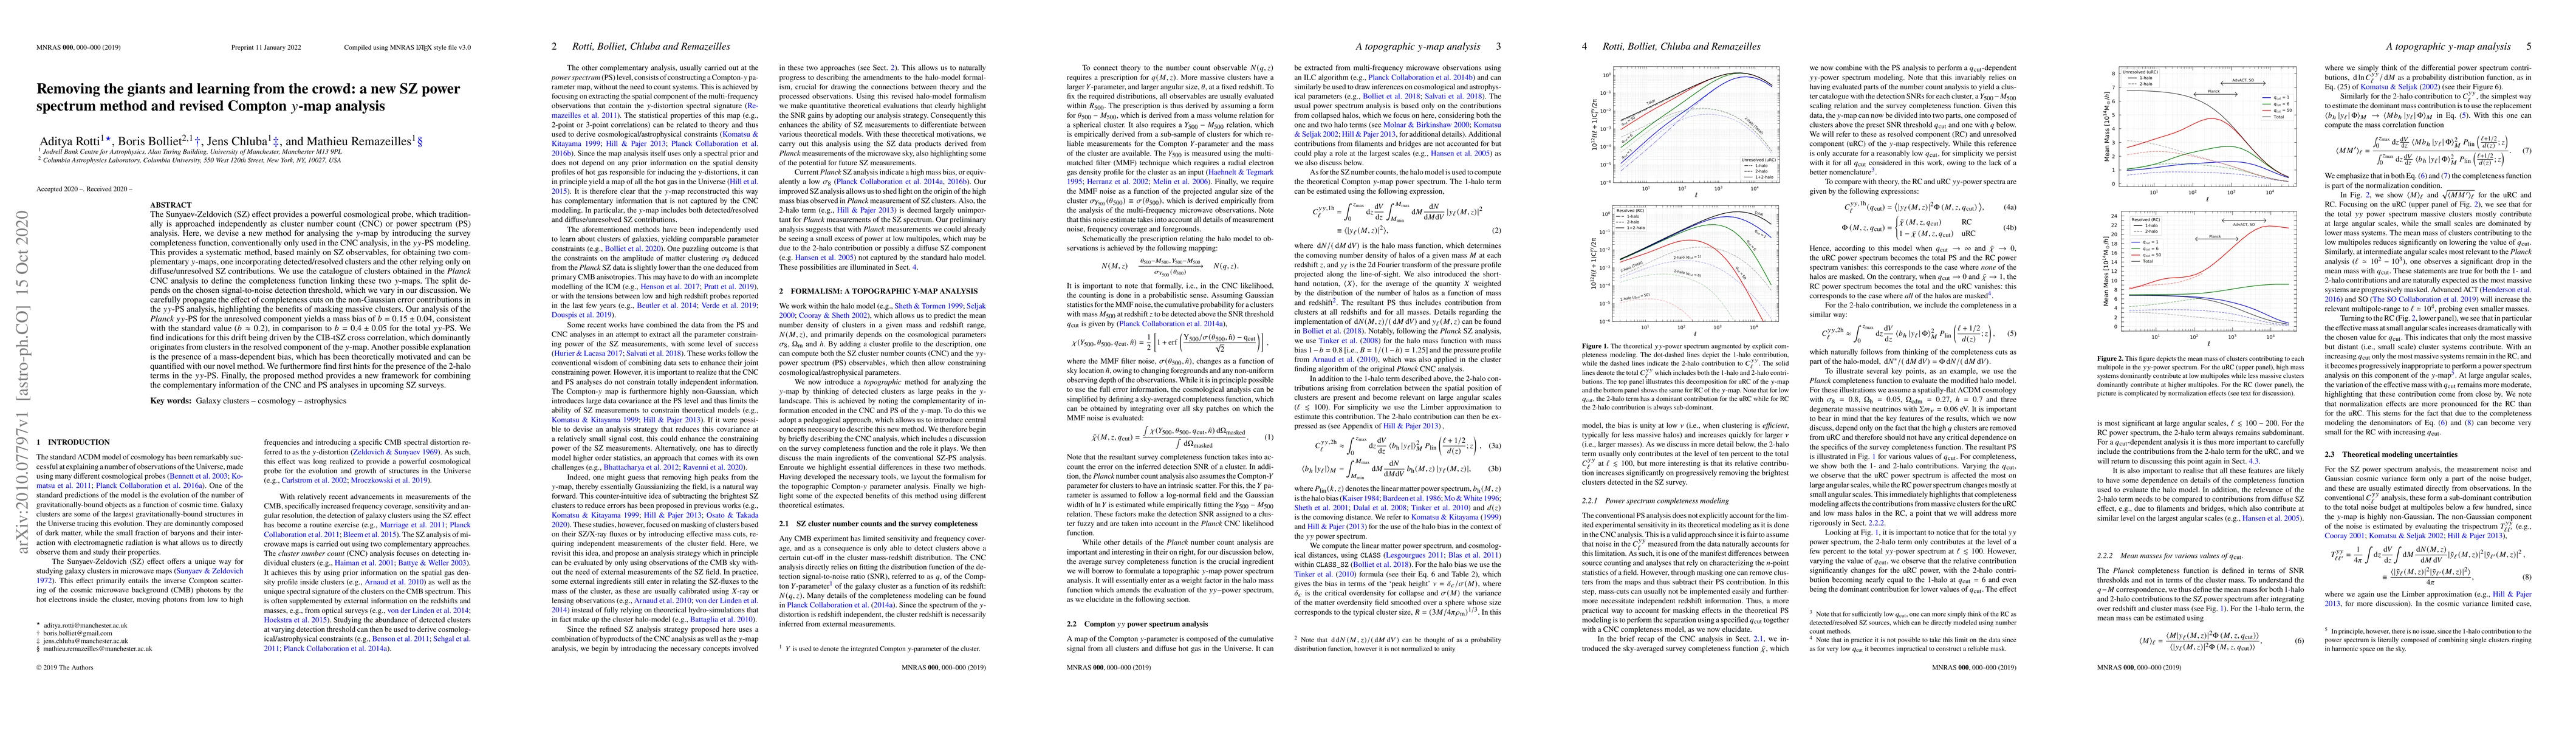
Paper Preview
Abstract
The Sunyaev-Zeldovich (SZ) effect provides a powerful cosmological probe, which traditionally is approached independently as cluster number count (CNC) or power spectrum (PS) analysis. Here, we devise a new method for analysing the $y$-map by introducing the survey completeness function, conventionally only used in the CNC analysis, in the $yy$-PS modeling. This provides a systematic method, based mainly on SZ observables, for obtaining two complementary $y$-maps, one incorporating detected/resolved clusters and the other relying only on diffuse/unresolved SZ contributions. We use the catalogue of clusters obtained in the \Planck CNC analysis to define the completeness function linking these two $y$-maps. The split depends on the chosen signal-to-noise detection threshold, which we vary in our discussion. We carefully propagate the effect of completeness cuts on the non-Gaussian error contributions in the $yy$-PS analysis, highlighting the benefits of masking massive clusters. Our analysis of the \Planck $yy$-PS for the unresolved component yields a mass bias of $b=0.15\pm0.04$, consistent with the standard value ($b\approx0.2$), in comparison to $b=0.4\pm 0.05$ for the total $yy$-PS. We find indications for this drift being driven by the CIB-tSZ cross correlation, which dominantly originates from clusters in the resolved component of the $y$-map. Another possible explanation is the presence of a mass-dependent bias, which has been theoretically motivated and can be quantified with our novel method. We furthermore find first hints for the presence of the 2-halo terms in the $yy$-PS. Finally, the proposed method provides a new framework for combining the complementary information of the CNC and PS analyses in upcoming SZ surveys.
AI Key Findings
Get AI-generated insights about this paper's methodology, results, significance, and more — seven facets brought into focus.
Impact
Paper Details
Authors
PDF Preview
Key Terms
Citation Network
Current paper (gray), citations (green), references (blue)
Display is limited for performance on very large graphs.
Discussion 0