Representing Outcome-driven Higher-order Dependencies in Graphs of Disease Trajectories
Publication
Metrics
AI Quick Summary
This paper proposes a method to represent higher-order dependencies in disease trajectories using graphs, specifically focusing on type 2 diabetes. The approach identifies risk factor combinations for outcomes and encodes these relationships in a graph, enhancing the performance of transformer models on predictive tasks.
Paper Preview
Abstract
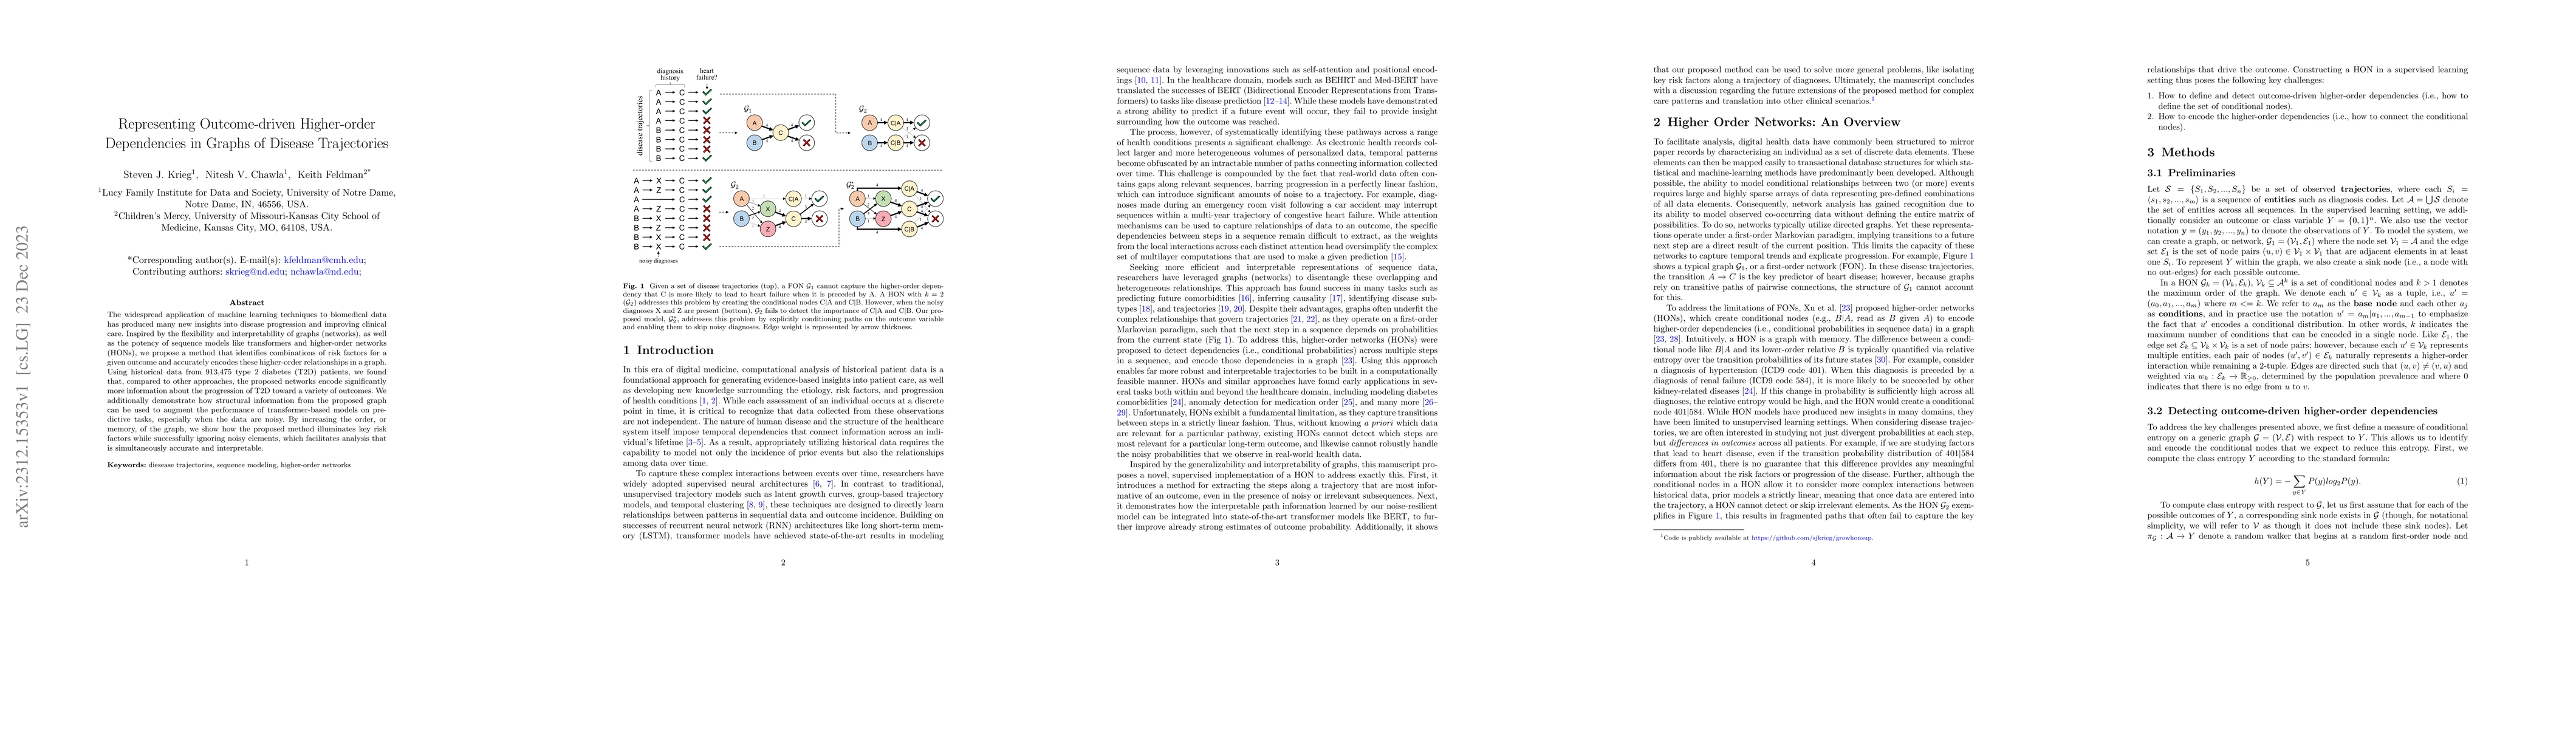
The widespread application of machine learning techniques to biomedical data has produced many new insights into disease progression and improving clinical care. Inspired by the flexibility and interpretability of graphs (networks), as well as the potency of sequence models like transformers and higher-order networks (HONs), we propose a method that identifies combinations of risk factors for a given outcome and accurately encodes these higher-order relationships in a graph. Using historical data from 913,475 type 2 diabetes (T2D) patients, we found that, compared to other approaches, the proposed networks encode significantly more information about the progression of T2D toward a variety of outcomes. We additionally demonstrate how structural information from the proposed graph can be used to augment the performance of transformer-based models on predictive tasks, especially when the data are noisy. By increasing the order, or memory, of the graph, we show how the proposed method illuminates key risk factors while successfully ignoring noisy elements, which facilitates analysis that is simultaneously accurate and interpretable.
AI Key Findings
Get AI-generated insights about this paper's methodology, results, significance, and more — seven facets brought into focus.
Impact
Paper Details
Authors
PDF Preview
Key Terms
Citation Network
Current paper (gray), citations (green), references (blue)
Display is limited for performance on very large graphs.
Discussion 0