Publication
Metrics
Paper Preview
Abstract
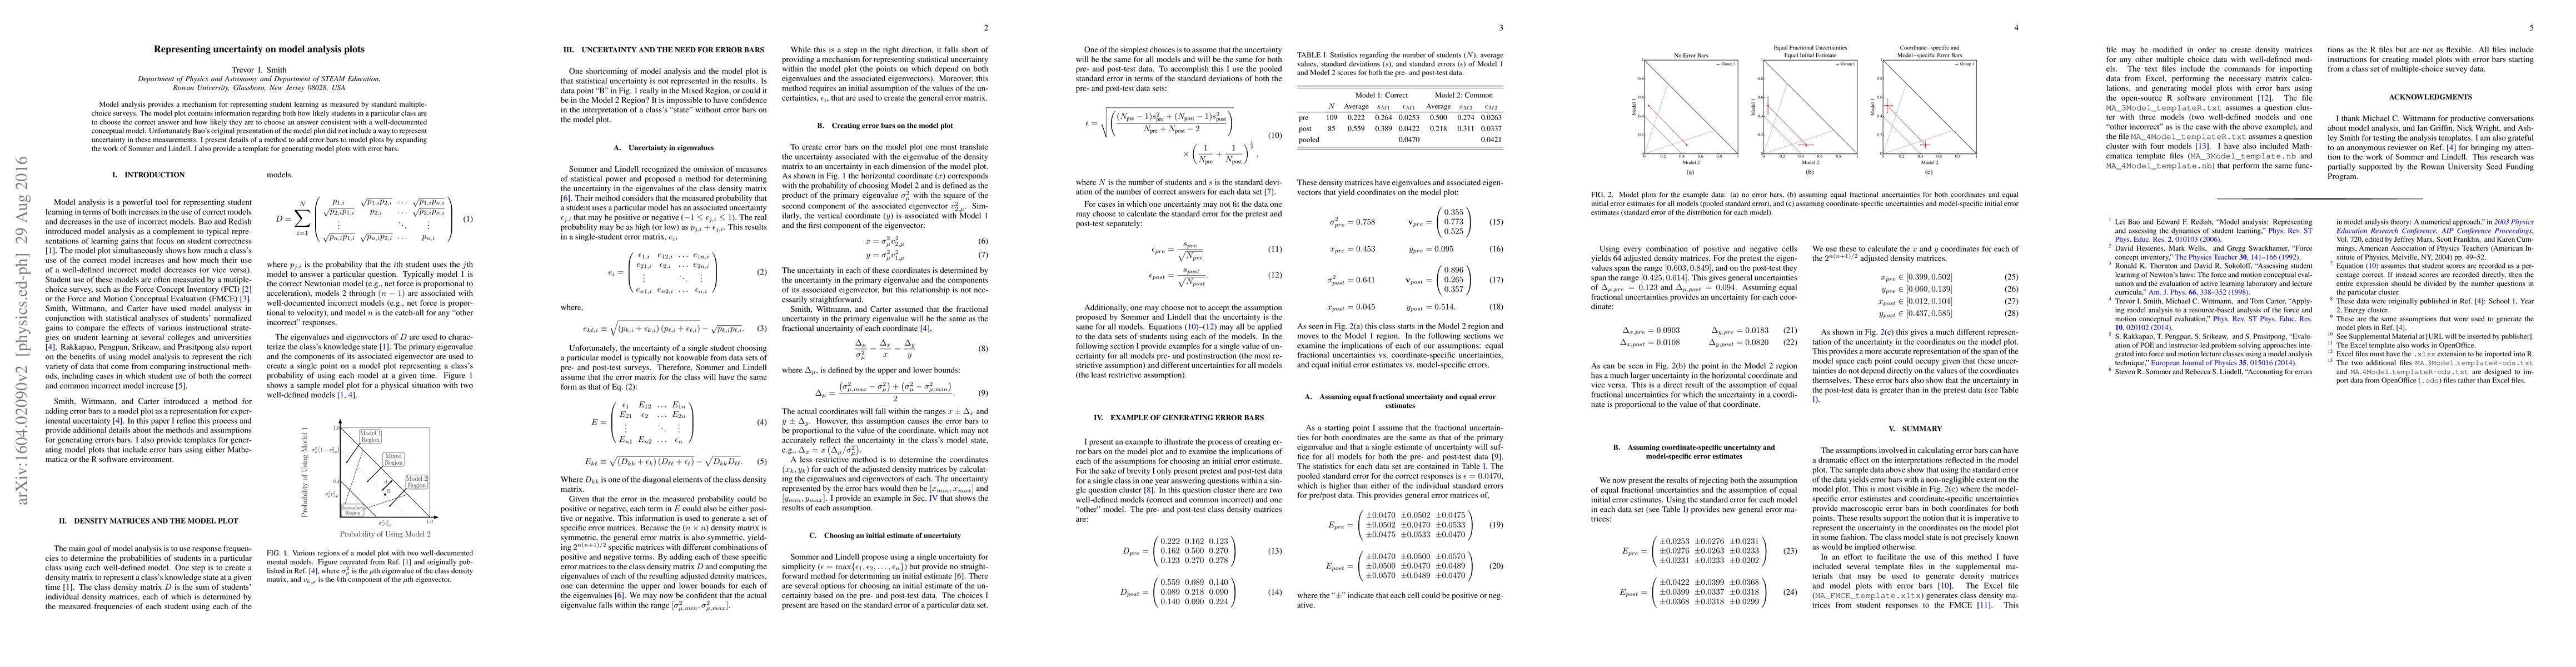
Model analysis provides a mechanism for representing student learning as measured by standard multiple-choice surveys. The model plot contains information regarding both how likely students in a particular class are to choose the correct answer and how likely they are to choose an answer consistent with a well-documented conceptual model. Unfortunately Bao's original presentation of the model plot did not include a way to represent uncertainty in these measurements. I present details of a method to add error bars to model plots by expanding the work of Sommer and Lindell. I also provide a template for generating model plots with error bars.
AI Key Findings
Get AI-generated insights about this paper's methodology, results, significance, and more — seven facets brought into focus.
Impact
Paper Details
PDF Preview
Key Terms
Citation Network
Current paper (gray), citations (green), references (blue)
Display is limited for performance on very large graphs.
Discussion 0