ArxivLens

Quick Summary:

This paper proposes a Model-Driven Architecture (MDA) approach to simplify the selection of appropriate visualization techniques for Big Data Analytics, focusing on non-expert users. The approach uses three models: requirements, data representation, and visualization, with transformations to semi-automatically generate suitable visualizations based on user information needs, demonstrated through a case study in a tax collection organization.

Journal Reference: 38th International Conference on Conceptual Modeling (ER 2019)
DOI: 10.1007/978-3-030-33223-5_8
arXiv Id: 2402.07914
Date Published: 2024-02-14
Date Updated: 2024-02-14

Categories:

Key Terms (TF-IDF):

visualization (0.337)
representing (0.232)
big (0.230)
big (0.214)
expert (0.205)
requirements (0.203)
representing (0.203)
requirements (0.201)
expert (0.192)
users (0.192)
approach based (0.184)
users (0.183)
proposal (0.180)
proposal (0.178)
approach based (0.176)
visual (0.158)
right (0.154)
visual (0.151)
right (0.151)
implementation (0.150)
License: http://creativecommons.org/licenses/by-sa/4.0/

Summary:

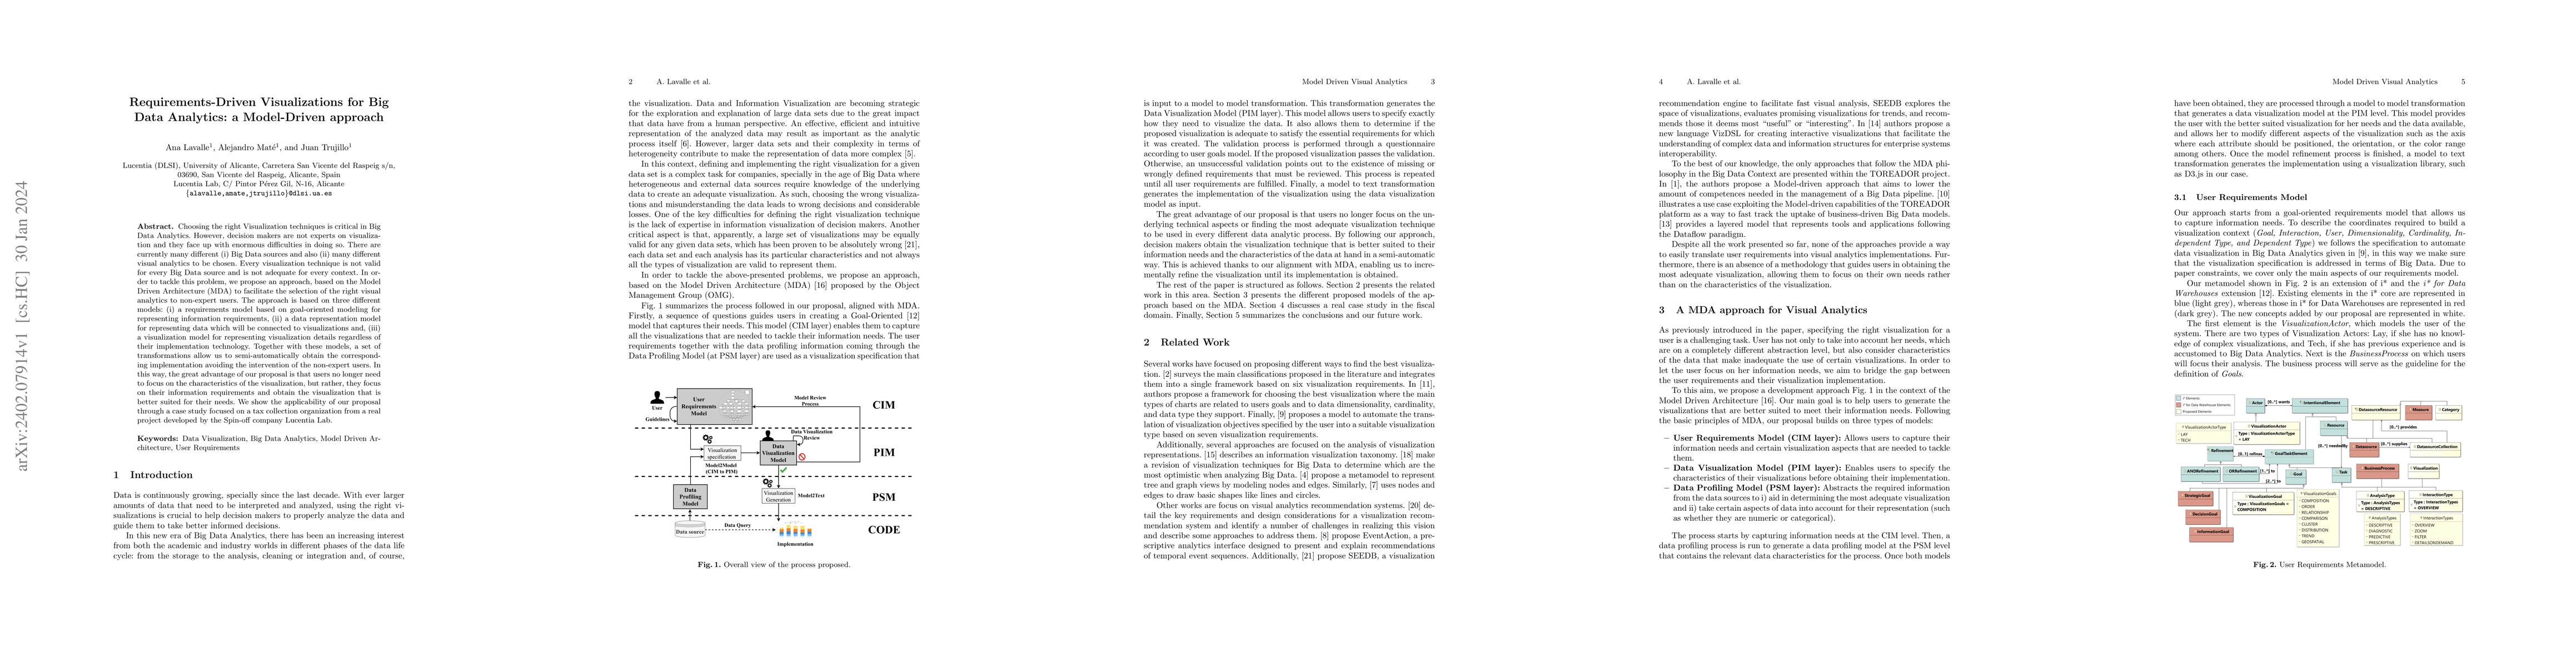
Choosing the right Visualization techniques is critical in Big Data Analytics. However, decision makers are not experts on visualization and they face up with enormous difficulties in doing so. There are currently many different (i) Big Data sources and also (ii) many different visual analytics to be chosen. Every visualization technique is not valid for every Big Data source and is not adequate for every context. In order to tackle this problem, we propose an approach, based on the Model Driven Architecture (MDA) to facilitate the selection of the right visual analytics to non-expert users. The approach is based on three different models: (i) a requirements model based on goal-oriented modeling for representing information requirements, (ii) a data representation model for representing data which will be connected to visualizations and, (iii) a visualization model for representing visualization details regardless of their implementation technology. Together with these models, a set of transformations allow us to semi-automatically obtain the corresponding implementation avoiding the intervention of the non-expert users. In this way, the great advantage of our proposal is that users no longer need to focus on the characteristics of the visualization, but rather, they focus on their information requirements and obtain the visualization that is better suited for their needs. We show the applicability of our proposal through a case study focused on a tax collection organization from a real project developed by the Spin-off company Lucentia Lab.

Citation & Reference Network Visualization

This graph shows how this paper is connected to other research. The current paper is shown in dark gray, papers that cite it are in green, and papers it references are in blue. You can:

Current Paper
Papers citing this work (Citations)
Papers cited by this work (References)

• Hover over any node to see the paper title

• Click a node to view that paper's details

• Drag nodes to rearrange the graph

• Use the zoom controls (bottom right) to zoom in/out

Citations and References

Title Authors Year Actions
Automating Business Intelligence Requirements with Generative AI and Semantic Search
Nimrod Busany, Ethan Hadar, Hananel Hadad, Gil Rosenblum, Zofia Maszlanka, O. Akhigbe, Daniel Amyot
2024
View Paper
Towards a framework for developing visual analytics in supply chain environments
Ali Khakpour, R. Colomo-Palacios, A. Martini
2023
View Paper
Supporting the digital transformation of SMEs — trained digital evangelists facilitating the positioning phase
J. Kääriäinen, Leila Saari, Maarit Tihinen, Sari Perätalo, T. Koivumäki
2023
View Paper
Conceptual modeling in the era of Big Data and Artificial Intelligence: Research topics and introduction to the special issue
J. Trujillo, K. Davis, Xiaoyong Du, E. Damiani, V. Storey
2021
View Paper
A brief review of dashboard visualizations employed to support management or business decisions
Davi Augusto Galúcio Frazão, Thiago S. A. Costa, Tiago Araújo, B. Meiguins, Carlos G. R. Santos
2021
View Paper
A methodology to automatically translate user requirements into visualizations: Experimental validation
Ana Lavalle, A. Maté, J. Trujillo, Miguel A. Teruel, S. Rizzi
2021
View Paper
Fostering Sustainability through Visualization Techniques for Real-Time IoT Data: A Case Study Based on Gas Turbines for Electricity Production
Ana Lavalle, Miguel A. Teruel, A. Maté, J. Trujillo
2020
View Paper
A Meta-Model Integration for Supporting Knowledge Discovery in Specific Domains: A Case Study in Healthcare
Andrea Vázquez-Ingelmo, A. García-Holgado, F. García-Peñalvo, Roberto Therón
2020
View Paper
Improving Sustainability of Smart Cities through Visualization Techniques for Big Data from IoT Devices
Ana Lavalle, Miguel A. Teruel, A. Maté, J. Trujillo
2020
View Paper
Visualization Requirements for Business Intelligence Analytics: A Goal-Based, Iterative Framework
Ana Lavalle, A. Maté, J. Trujillo, S. Rizzi
2019
View Paper
ModelViz: A Model-Driven Engineering Approach for Visual Analytics System Design
Alireza Khakpour, Andrea Vázquez-Ingelmo, R. Colomo-Palacios, F. García-Peñalvo, Antonio Martini
2024
View Paper
A Data Analytics Methodology to Visually Analyze the Impact of Bias and Rebalancing
Ana Lavalle, A. Maté, J. Trujillo, Miguel A. Teruel
2023
View Paper
An Approach to Automatically Detect and Visualize Bias in Data Analytics
Ana Lavalle, A. Maté, J. Trujillo
2020
View Paper
Alma Mater Studiorum Università di Bologna Archivio
Ana Lavalle, Alejandro Maté, Juan Trujillo, Miguel A. Teruel, Stefano Rizzi
View Paper
Towards a framework for developing visual analytics in supply Towards a framework for developing visual analytics in supply chain environments chain environments
Alireza Khakpour, R. Colomo-Palacios, Antonio Martini
View Paper

Comments (0)

This website uses cookies to ensure you get the best experience. Learn more