Summary
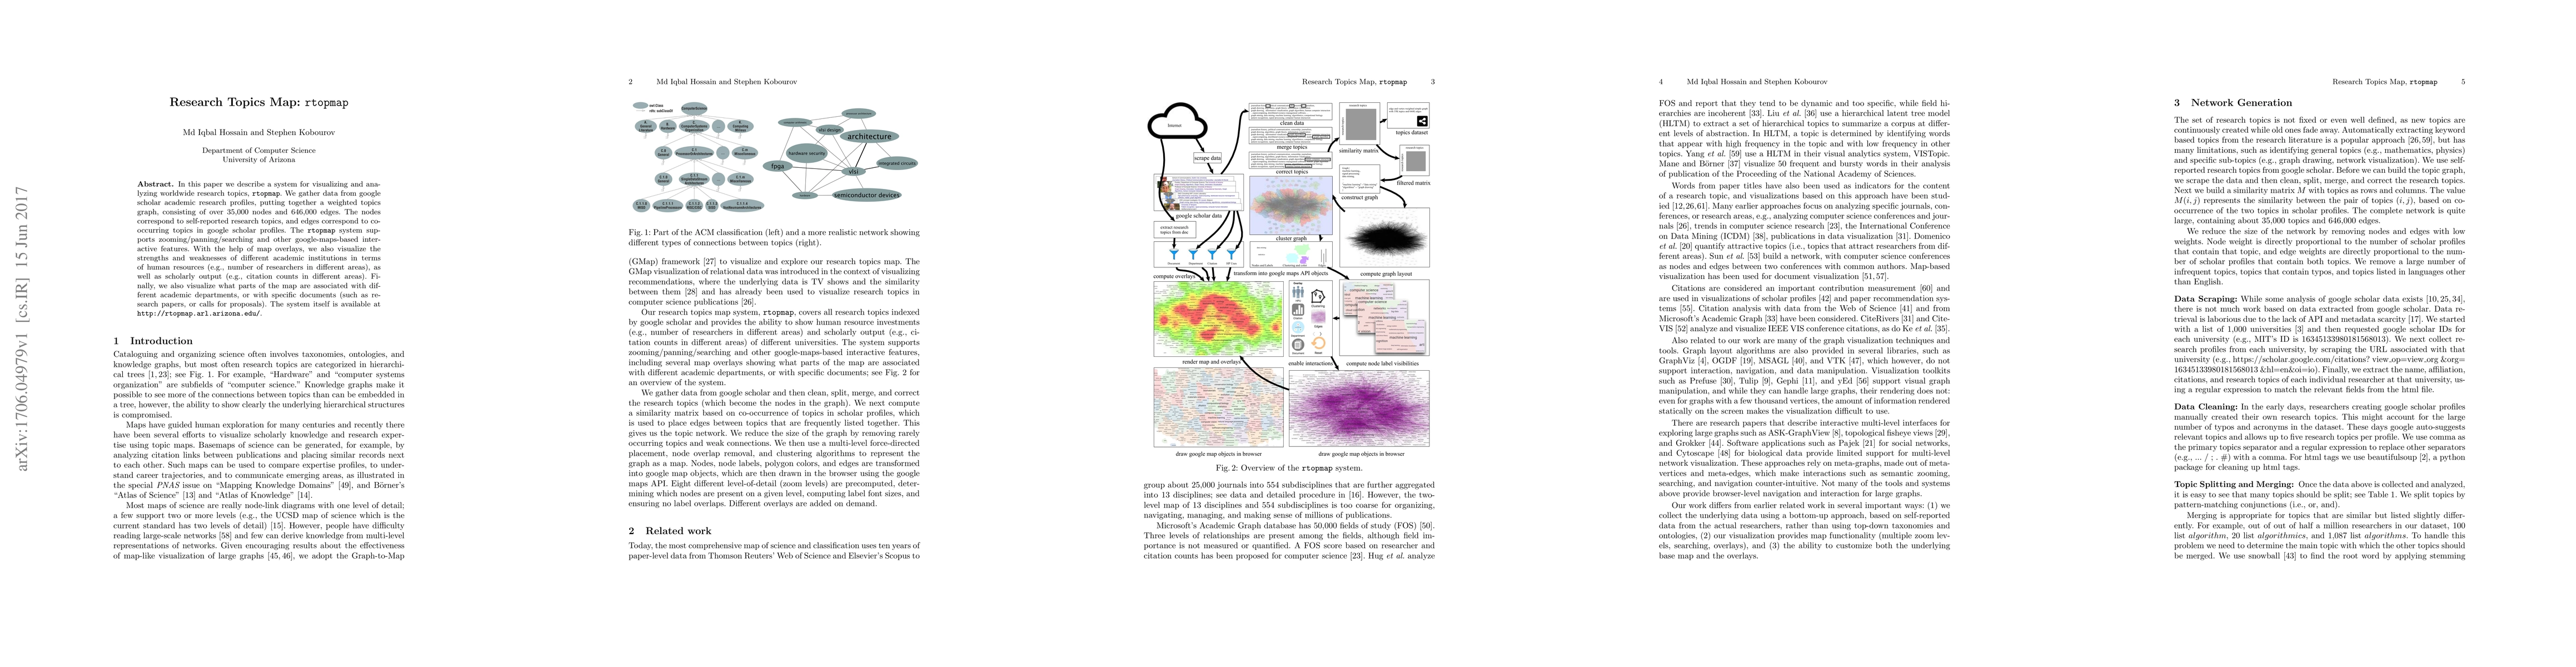
In this paper we describe a system for visualizing and analyzing worldwide research topics, {\tt rtopmap}. We gather data from google scholar academic research profiles, putting together a weighted topics graph, consisting of over 35,000 nodes and 646,000 edges. The nodes correspond to self-reported research topics, and edges correspond to co-occurring topics in google scholar profiles. The {\tt rtopmap} system supports zooming/panning/searching and other google-maps-based interactive features. With the help of map overlays, we also visualize the strengths and weaknesses of different academic institutions in terms of human resources (e.g., number of researchers in different areas), as well as scholarly output (e.g., citation counts in different areas). Finally, we also visualize what parts of the map are associated with different academic departments, or with specific documents (such as research papers, or calls for proposals). The system itself is available at \url{http://rtopmap.arl.arizona.edu/}.
AI Key Findings
Get AI-generated insights about this paper's methodology, results, and significance.
Paper Details
PDF Preview
Key Terms
Citation Network
Current paper (gray), citations (green), references (blue)
Display is limited for performance on very large graphs.
Similar Papers
Found 4 papersCan Artificial Intelligence Generate Quality Research Topics Reflecting Patient Concerns?
Jiyeong Kim, Shawheen J. Rezaei, Kavita Y. Sarin et al.
A Research Vision for Web Search on Emerging Topics
Stefan Dietze, Ran Yu, Alisa Rieger
| Title | Authors | Year | Actions |
|---|
Comments (0)