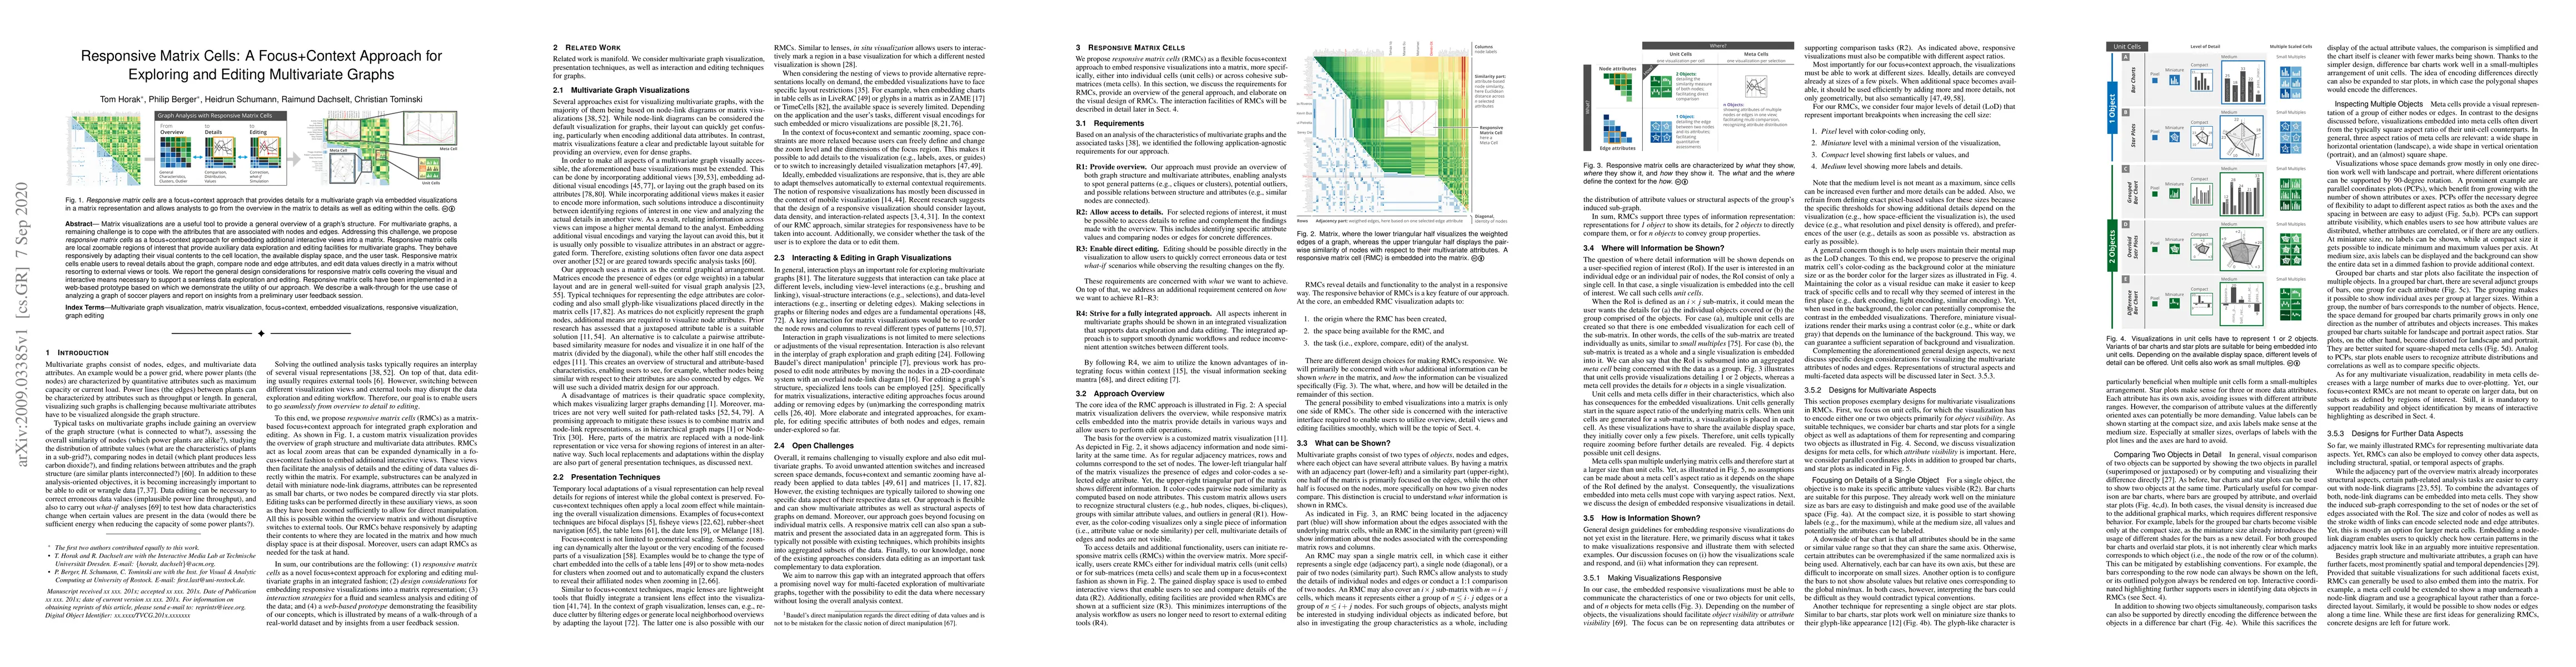
Matrix visualizations are a useful tool to provide a general overview of a graph's structure. For multivariate graphs, a remaining challenge is to cope with the attributes that are associated with nodes and edges. Addressing this challenge, we propose responsive matrix cells as a focus+context approach for embedding additional interactive views into a matrix. Responsive matrix cells are local zoomable regions of interest that provide auxiliary data exploration and editing facilities for multivariate graphs. They behave responsively by adapting their visual contents to the cell location, the available display space, and the user task. Responsive matrix cells enable users to reveal details about the graph, compare node and edge attributes, and edit data values directly in a matrix without resorting to external views or tools. We report the general design considerations for responsive matrix cells covering the visual and interactive means necessary to support a seamless data exploration and editing. Responsive matrix cells have been implemented in a web-based prototype based on which we demonstrate the utility of our approach. We describe a walk-through for the use case of analyzing a graph of soccer players and report on insights from a preliminary user feedback session.
Get AI-generated insights about this paper's methodology, results, and significance.
Current paper (gray), citations (green), references (blue)
Title | Authors | Year | Actions |
---|---|---|---|
BEMTrace: Visualization-Driven Approach for Deriving Building Energy Models from BIM
|
A. Walch, Attila Szabó, H. Steinlechner, Thomas Ortner, Eduard Gröller, Johanna Schmidt
|
2024
|
View Paper |
Input Visualization: Collecting and Modifying Data with Visual Representations
|
Nathalie Bressa, Jordan Louis, Wesley Willett, Samuel Huron
|
2024
|
View Paper |
This is the Table I Want! Interactive Data Transformation on Desktop and in Virtual Reality
|
Sungwon In, Tica Lin, Chris North, Hanspeter Pfister, Yalong Yang
|
2023
|
View Paper |
2D, 2.5D, or 3D? An Exploratory Study on Multilayer Network Visualisations in Virtual Reality
|
S. P. Feyer, Bruno Pinaud, S. Kobourov, N. Brich, M. Krone, A. Kerren, M. Behrisch, Falk Schreiber, Karsten Klein
|
2023
|
View Paper |
Unfolding Edges: Adding Context to Edges in Multivariate Graph Visualization
|
Mark-Jan Bludau, M. Dörk, C. Tominski
|
2023
|
View Paper |
Comparing Nodes of Multivariate Graphs Through Dynamic Layout Adaptations
|
P. Berger, Sebastian Beleites, C. Tominski
|
2023
|
View Paper |
Multivariate Fence: Using Parallel Coordinates to Locate and Compare Attributes of Adjacency Matrix Nodes in Immersive Environment
|
Tiemeng Li, Yanning Jin, Songqian Wu, Shiran Liu
|
2022
|
View Paper |
Multi-View Design Patterns and Responsive Visualization for Genomics Data
|
S. L’Yi, Nils Gehlenborg
|
2022
|
View Paper |
Graph Exploration With Embedding-Guided Layouts
|
Leixian Shen, Zhiwei Tai, Enya Shen, Jianmin Wang
|
2022
|
View Paper |
Carbonic: A Framework for Creating and Visualizing Complex Compound Graphs
|
Cristian Rodriguez, Pablo Toharia, L. Pastor, S. Mata
|
2022
|
View Paper |
Who benefits from Visualization Adaptations? Towards a better Understanding of the Influence of Visualization Literacy
|
Marc Satkowski, F. Kessler, S. Narciss, Raimund Dachselt
|
2022
|
View Paper |
Data+Shift: Supporting visual investigation of data distribution shifts by data scientists
|
João Palmeiro, Beatriz Malveiro, Rita Costa, David Polido, Ricardo Moreira, P. Bizarro
|
2022
|
View Paper |
The Pattern is in the Details: An Evaluation of Interaction Techniques for Locating, Searching, and Contextualizing Details in Multivariate Matrix Visualizations
|
Yalong Yang, Wenyu Xia, Fritz Lekschas, C. Nobre, Robert Krueger, Hanspeter Pfister
|
2022
|
View Paper |
Responsive Visualization Design for Mobile Devices
|
Tom Horak, W. Aigner, M. Brehmer, Alark Joshi, C. Tominski
|
2021
|
View Paper |
CommAID: Visual Analytics for Communication Analysis through Interactive Dynamics Modeling
|
M. T. Fischer, Daniel Seebacher, R. Sevastjanova, D. Keim, Mennatallah El-Assady
|
2021
|
View Paper |
Toward flexible visual analytics augmented through smooth display transitions
|
C. Tominski, G. Andrienko, N. Andrienko, S. Bleisch, S. Fabrikant, E. Mayr, S. Miksch, M. Pohl, A. Skupin
|
2021
|
View Paper |
Towards Visualizing and Exploring Multivariate Networks on Mobile Devices
|
Tom Horak, Ricardo Langner, Raimund Dachselt
|
2020
|
View Paper |
A Tour Through the Zoo of Scented Widgets
|
V. Ciorna, N. Médoc, G. Melançon, F. Petry, M. Ghoniem
|
2023
|
View Paper |
Interactive Visual Analysis of Regional Time Series Correlation in Multi-field Climate Ensembles
|
Marina Evers, M. Böttinger, L. Linsen
|
2023
|
View Paper |
Towards Understanding Edit Histories of Multivariate Graphs
|
P. Berger, H. Schumann, C. Tominski
|
2022
|
View Paper |
MOBS - Multi-Omics Brush for Subgraph Visualisation
|
D. Heylen, J. Peeters, G. Ertaylan, J. Hooyberghs, J. Aerts
|
2022
|
View Paper |
Blocks: Creating Rich Tables with Drag-and-Drop Interaction
|
Allison Whilden, Dirk Karis, V. Setlur, R. Degtyar, Jonathan Que, Filippos Lymperopoulos
|
2022
|
View Paper |
A Stratification Matrix Viewer for Analysis of Neural Network Data
|
Philipp Harth, S. Vohra, D. Udvary, M. Oberländer, H. Hege, D. Baum
|
2022
|
View Paper |
MULTIAGR: A Technique for Aggregating Multivariate Networks
|
P. Rajan
|
2021
|
View Paper |
Immersive Analytics of Heterogeneous Biological Data Informed through Need-finding Interviews
|
Chris Ripken, Sebastian Tusk, C. Tominski
|
2021
|
View Paper |
Toward flexible visual analytics augmented through smooth display transitions
|
C. Tominski, G. Andrienko, N. Andrienko, S. Bleisch, ara Irina Fabrikant, E. Mayr, S. Miksch, M. Pohl, A. Skupin
|
2021
|
View Paper |
Unfolding Edges for Exploring Multivariate Edge Attributes in Graphs
|
Mark-Jan Bludau, M. Dörk, C. Tominski
|
2021
|
View Paper |
Integrating Visual Exploration and Direct Editing of Multivariate Graphs
|
P. Berger, Heidrun Schumann, C. Tominski
|
View Paper |
Comments (0)