Rethinking Comprehensive Benchmark for Chart Understanding: A Perspective from Scientific Literature
Publication
Metrics
AI Quick Summary
This paper introduces a new benchmark, SCI-CQA, to more accurately assess multimodal models' understanding of scientific literature charts, addressing existing benchmarks' limitations in chart variety and evaluation methods. The benchmark features a curated dataset of 37,607 high-quality charts and an extensive evaluation framework with 5,629 questions, emphasizing the importance of contextual information.
Paper Preview
Abstract
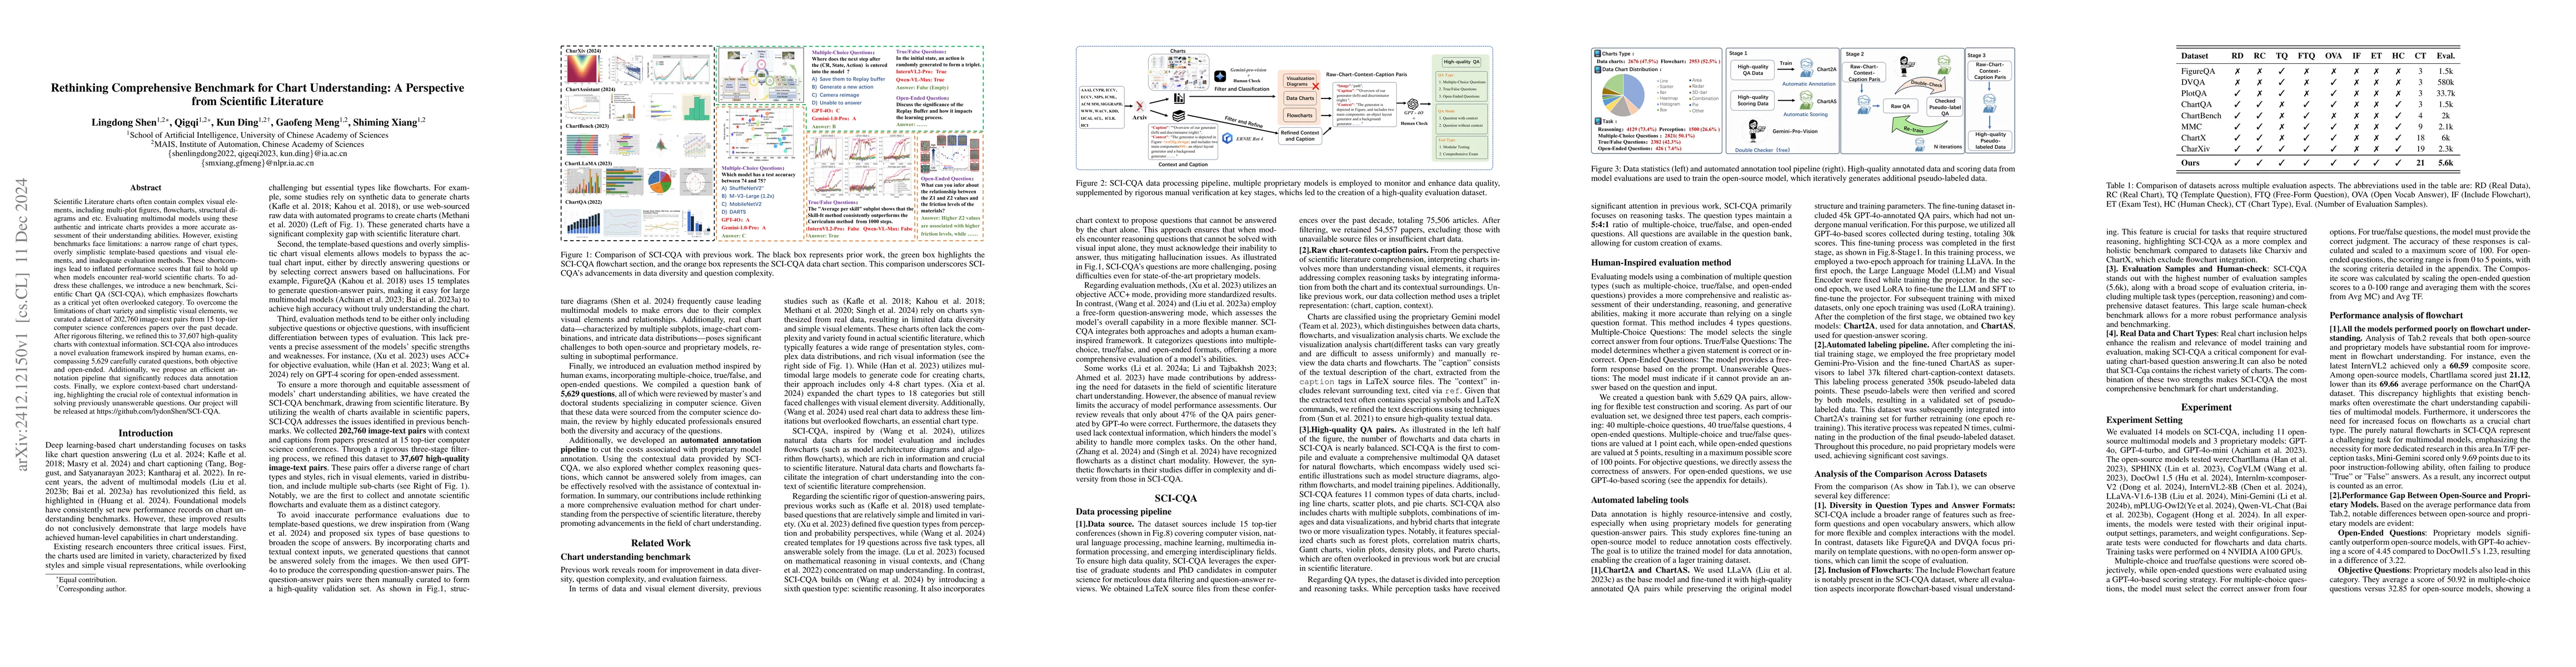
Scientific Literature charts often contain complex visual elements, including multi-plot figures, flowcharts, structural diagrams and etc. Evaluating multimodal models using these authentic and intricate charts provides a more accurate assessment of their understanding abilities. However, existing benchmarks face limitations: a narrow range of chart types, overly simplistic template-based questions and visual elements, and inadequate evaluation methods. These shortcomings lead to inflated performance scores that fail to hold up when models encounter real-world scientific charts. To address these challenges, we introduce a new benchmark, Scientific Chart QA (SCI-CQA), which emphasizes flowcharts as a critical yet often overlooked category. To overcome the limitations of chart variety and simplistic visual elements, we curated a dataset of 202,760 image-text pairs from 15 top-tier computer science conferences papers over the past decade. After rigorous filtering, we refined this to 37,607 high-quality charts with contextual information. SCI-CQA also introduces a novel evaluation framework inspired by human exams, encompassing 5,629 carefully curated questions, both objective and open-ended. Additionally, we propose an efficient annotation pipeline that significantly reduces data annotation costs. Finally, we explore context-based chart understanding, highlighting the crucial role of contextual information in solving previously unanswerable questions.
AI Key Findings
Get AI-generated insights about this paper's methodology, results, significance, and more — seven facets brought into focus.
Impact
Authors
PDF Preview
Citation Network
Current paper (gray), citations (green), references (blue)
Display is limited for performance on very large graphs.
Related Papers
No references found for this paper.
Discussion 0