Rethinking Performance Measures of RNA Secondary Structure Problems
Publication
Metrics
AI Quick Summary
This paper proposes the Weisfeiler-Lehman graph kernel (WL) as a new metric for evaluating RNA secondary structure prediction, arguing that traditional measures like F1 score and MCC are inadequate for complex tertiary interactions. The WL metric offers a more accurate and informative assessment, as demonstrated through an RNA design experiment.
Paper Preview
Abstract
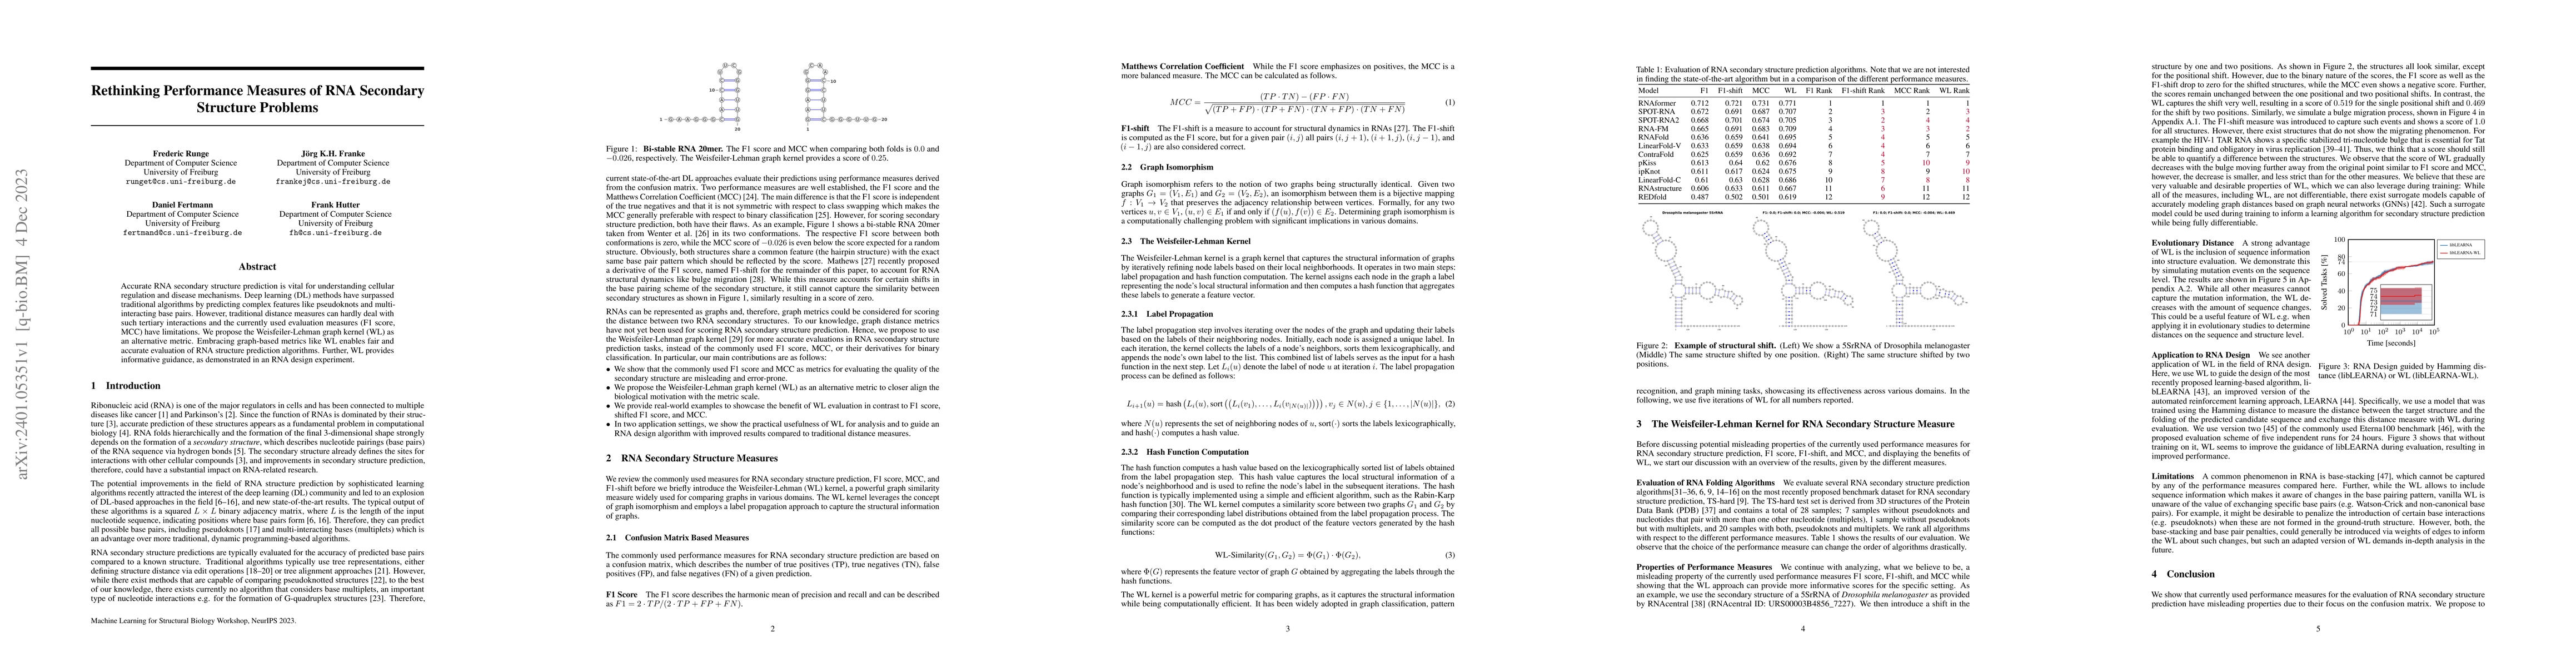
Accurate RNA secondary structure prediction is vital for understanding cellular regulation and disease mechanisms. Deep learning (DL) methods have surpassed traditional algorithms by predicting complex features like pseudoknots and multi-interacting base pairs. However, traditional distance measures can hardly deal with such tertiary interactions and the currently used evaluation measures (F1 score, MCC) have limitations. We propose the Weisfeiler-Lehman graph kernel (WL) as an alternative metric. Embracing graph-based metrics like WL enables fair and accurate evaluation of RNA structure prediction algorithms. Further, WL provides informative guidance, as demonstrated in an RNA design experiment.
OpenAlex
- Citations in OpenAlex
- 4
- Publication year
- 2023
- Access status
- Open access
Source: OpenAlex · Snapshot
AI Key Findings
Get AI-generated insights about this paper's methodology, results, significance, and more — seven facets brought into focus.
Impact
Paper Details
Authors
PDF Preview
Key Terms
Citation Network
Current paper (gray), citations (green), references (blue)
Display is limited for performance on very large graphs.
Discussion 0