ArxivLens

Quick Summary:

This paper proposes a neural network-based method for reverse-engineering bar charts to extract textual and numeric information efficiently. It uses an object detection model for textual information and an encoder-decoder framework with attention for numeric data, demonstrating effectiveness on synthetic and real datasets.

arXiv Id: 2009.02491
Date Published: 2020-09-08
Date Updated: 2020-09-08

Categories:

Key Terms (TF-IDF):

textual (0.283)
reverse (0.269)
bar (0.249)
engineering (0.230)
based method (0.216)
neural network (0.197)
neural (0.190)
information (0.179)
network (0.148)
attention mechanism (0.133)
encoder decoder (0.132)
recurrent neural (0.129)
integrates (0.128)
high accuracy (0.127)
synthetic real (0.126)
best knowledge (0.124)
adopt (0.123)
decoder (0.122)
classify (0.121)
recurrent (0.121)
License: http://arxiv.org/licenses/nonexclusive-distrib/1.0/

Summary:

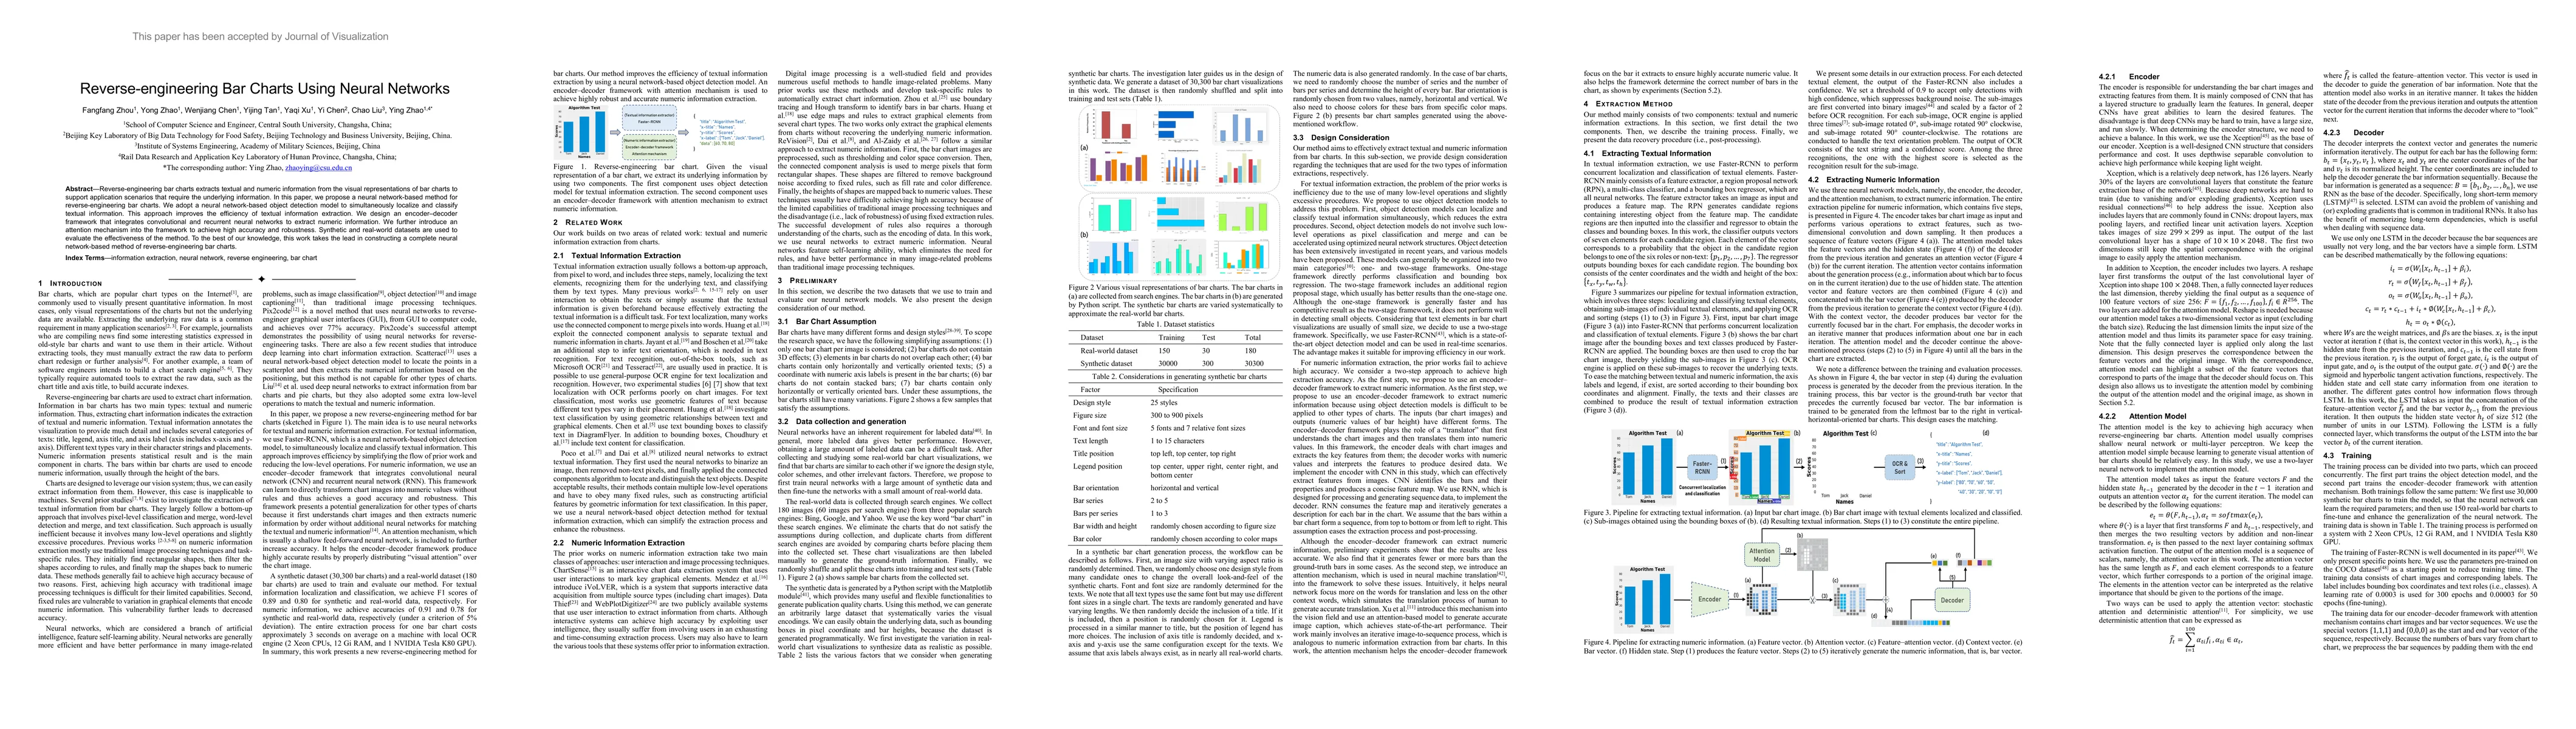
Reverse-engineering bar charts extracts textual and numeric information from the visual representations of bar charts to support application scenarios that require the underlying information. In this paper, we propose a neural network-based method for reverse-engineering bar charts. We adopt a neural network-based object detection model to simultaneously localize and classify textual information. This approach improves the efficiency of textual information extraction. We design an encoder-decoder framework that integrates convolutional and recurrent neural networks to extract numeric information. We further introduce an attention mechanism into the framework to achieve high accuracy and robustness. Synthetic and real-world datasets are used to evaluate the effectiveness of the method. To the best of our knowledge, this work takes the lead in constructing a complete neural network-based method of reverse-engineering bar charts.

Citation & Reference Network Visualization

This graph shows how this paper is connected to other research. The current paper is shown in dark gray, papers that cite it are in green, and papers it references are in blue. You can:

Current Paper
Papers citing this work (Citations)
Papers cited by this work (References)

• Hover over any node to see the paper title

• Click a node to view that paper's details

• Drag nodes to rearrange the graph

• Use the zoom controls (bottom right) to zoom in/out

Citations and References

Title Authors Year Actions
Automatic pipeline for information of curve graphs in papers based on deep learning
Yuexing Han, Jinhua Xia, Rui Zhang, Bing Wang, Yi Liu, Deng Pan, Yinggang Wang, Jiawang Zhang, Qiaochuan Chen
2025
View Paper
C3E: A framework for chart classification and content extraction
Muhammad Suhaib Kanroo, Hadia Showkat Kawoosa, Kapil Rana, Puneet Goyal
2025
View Paper
Effectiveness of using a bar model in solving story problems for elementary school students
Erna Yayuk, Beti Istanti Suwandayani, Alfiani Athma Putri Rosyadi, D. Ekowati, Agung Deddiliawan Ismail
2024
View Paper
AutoLegend: A User Feedback-Driven Adaptive Legend Generator for Visualizations
Can Liu, Xiyao Mei, Zhibang Jiang, Shaocong Tan, Xiaoru Yuan
2024
View Paper
OsmLocator: locating overlapping scatter marks with a non-training generative perspective
Yuming Qiu, Aleksandra Pižurica, Qi Ming, Nicolas Nadisic
2023
View Paper
An extensible point-based method for data chart value detection
Carlos Soto, Shinjae Yoo
2023
View Paper
Pay "Attention" to Chart Images for What You Read on Text
Chenyu Yang, Ruixue Fan, Nan Tang, Meihui Zhang, Xiaoman Zhao, Ju Fan, Xiaoyong Du
2023
View Paper
The State of the Art in Creating Visualization Corpora for Automated Chart Analysis
Chen Chen, Zhicheng Liu
2023
View Paper
Towards accessible chart visualizations for the non-visuals: Research, applications and gaps
Mandhatya Singh, Muhammad Suhaib Kanroo, Hadia Showkat Kawoosa, Puneet Goyal
2023
View Paper
ChartSumm: A Comprehensive Benchmark for Automatic Chart Summarization of Long and Short Summaries
Raian Rahman, Rizvi Hasan, Abdullah Al Farhad, Md Tahmid Rahman Laskar, Md. Hamjajul Ashmafee, A. Kamal
2023
View Paper
Review of chart image detection and classification
Filip Bajić, Josip Job
2023
View Paper
GraphDecoder: Recovering Diverse Network Graphs From Visualization Images via Attention-Aware Learning
Sicheng Song, Chenhui Li, Dong Li, Juntong Chen, Changbo Wang
2022
View Paper
An intelligent approach to automatically discovering visual insights
Yuhua Zhou, Xiyu Meng, Yanhong Wu, Tan Tang, Yongheng Wang, Yingcai Wu
2022
View Paper
Classification of Scatter Plot Images Using Deep Learning
Derya Birant, Aydanur Akça, Buse Bozkurt, Mehtap Bağlan
2022
View Paper
Usage one of Reverse Engineering Application (Node.js Web) to Construct Software Engineering Documents
N. Edan, Basim Mahmood
2022
View Paper
Data Extraction of Circular-Shaped and Grid-like Chart Images
Filip Bajić, Josip Job
2022
View Paper
COVID-19 Open-Data a global-scale spatially granular meta-dataset for coronavirus disease
O. Wahltinez, Aurora Cheung, R. Alcántara, D. Cheung, Mayank Daswani, Anthony Erlinger, Matt Lee, Pranali Yawalkar, Paula Lê, Ofir Picazo Navarro, M. Brenner, Kevin Murphy
2022
View Paper
COVID-19 Open-Data a global-scale spatially granular meta-dataset for coronavirus disease
O. Wahltinez, Aurora Cheung, R. Alcántara, D. Cheung, Mayank Daswani, Anthony Erlinger, Matt Lee, Pranali Yawalkar, Paula Lê, Ofir Picazo Navarro, Michael P. Brenner, Kevin Murphy
2022
View Paper
VividGraph: Learning to Extract and Redesign Network Graphs From Visualization Images
Sicheng Song, Chenhui Li, Yujing Sun, Changbo Wang
2022
View Paper
Graph Interpretation, Summarization and Visualization Techniques: A Review and Open Research Issues
P. Mishra, Santosh Kumar, M. K. Chaube
2022
View Paper
CHARTER: heatmap-based multi-type chart data extraction
J. Shtok, Sivan Harary, Ophir Azulai, Adi Raz Goldfarb, Assaf Arbelle, Leonid Karlinsky
2021
View Paper
Chart Classification Using Siamese CNN
Filip Bajić, Josip Job
2021
View Paper
Evaginating scientific charts: Recovering direct and derived information encodings from chart images
P. Mishra, Santosh Kumar, M. K. Chaube
2021
View Paper
Toward Automatic Interpretation of 3D Plots
Laura E. Brandt, W. Freeman
2021
View Paper
VisImages: A Fine-Grained Expert-Annotated Visualization Dataset
Dazhen Deng, Yihong Wu, Xinhuan Shu, Jiang Wu, Siwei Fu, Weiwei Cui, Yingnian Wu
2020
View Paper
FlowchartQA: The First Large-Scale Benchmark for Reasoning over Flowcharts
Simon Tannert, Marcelo G. Feighelstein, Jasmina Bogojeska, J. Shtok, Assaf Arbelle, Peter W. J. Staar, Anika Schumann, Jonas Kuhn, Leonid Karlinsky
2023
View Paper
OsmLocator: locating overlapping scatter marks by simulated annealing on clustering-based re-visualization
Yuming Qiu, Aleksandra Pižurica, Qi Ming, Nicolas Nadisic
View Paper

Similar Papers

SNIFF: Reverse Engineering of Neural Networks with Fault Attacks

Yang Liu, Dirmanto Jap, Jakub Breier, Shivam Bhasin, Xiaolu Hou

Published: 2023-03-01

AppGNN: Approximation-Aware Functional Reverse Engineering using Graph Neural Networks

Ozgur Sinanoglu, Lilas Alrahis, Hussam Amrouch, Guilherme Paim, Tim Bucher, Sergio Bampi

Published: 2022-08-24

Comments (0)

This website uses cookies to ensure you get the best experience. Learn more