Revisiting the Mass-Excitation (MEx) diagram using the MaNGA dataset
Publication
Metrics
AI Quick Summary
This paper revisits the mass-excitation diagram using the MaNGA dataset, finding that the ionization mechanism in high-redshift galaxies requires the equivalent width of the H$\alpha$ emission line for accurate classification. The study also notes that the galaxy's position in the diagram depends on whether central or integrated spectral properties are used.
Paper Preview
Abstract
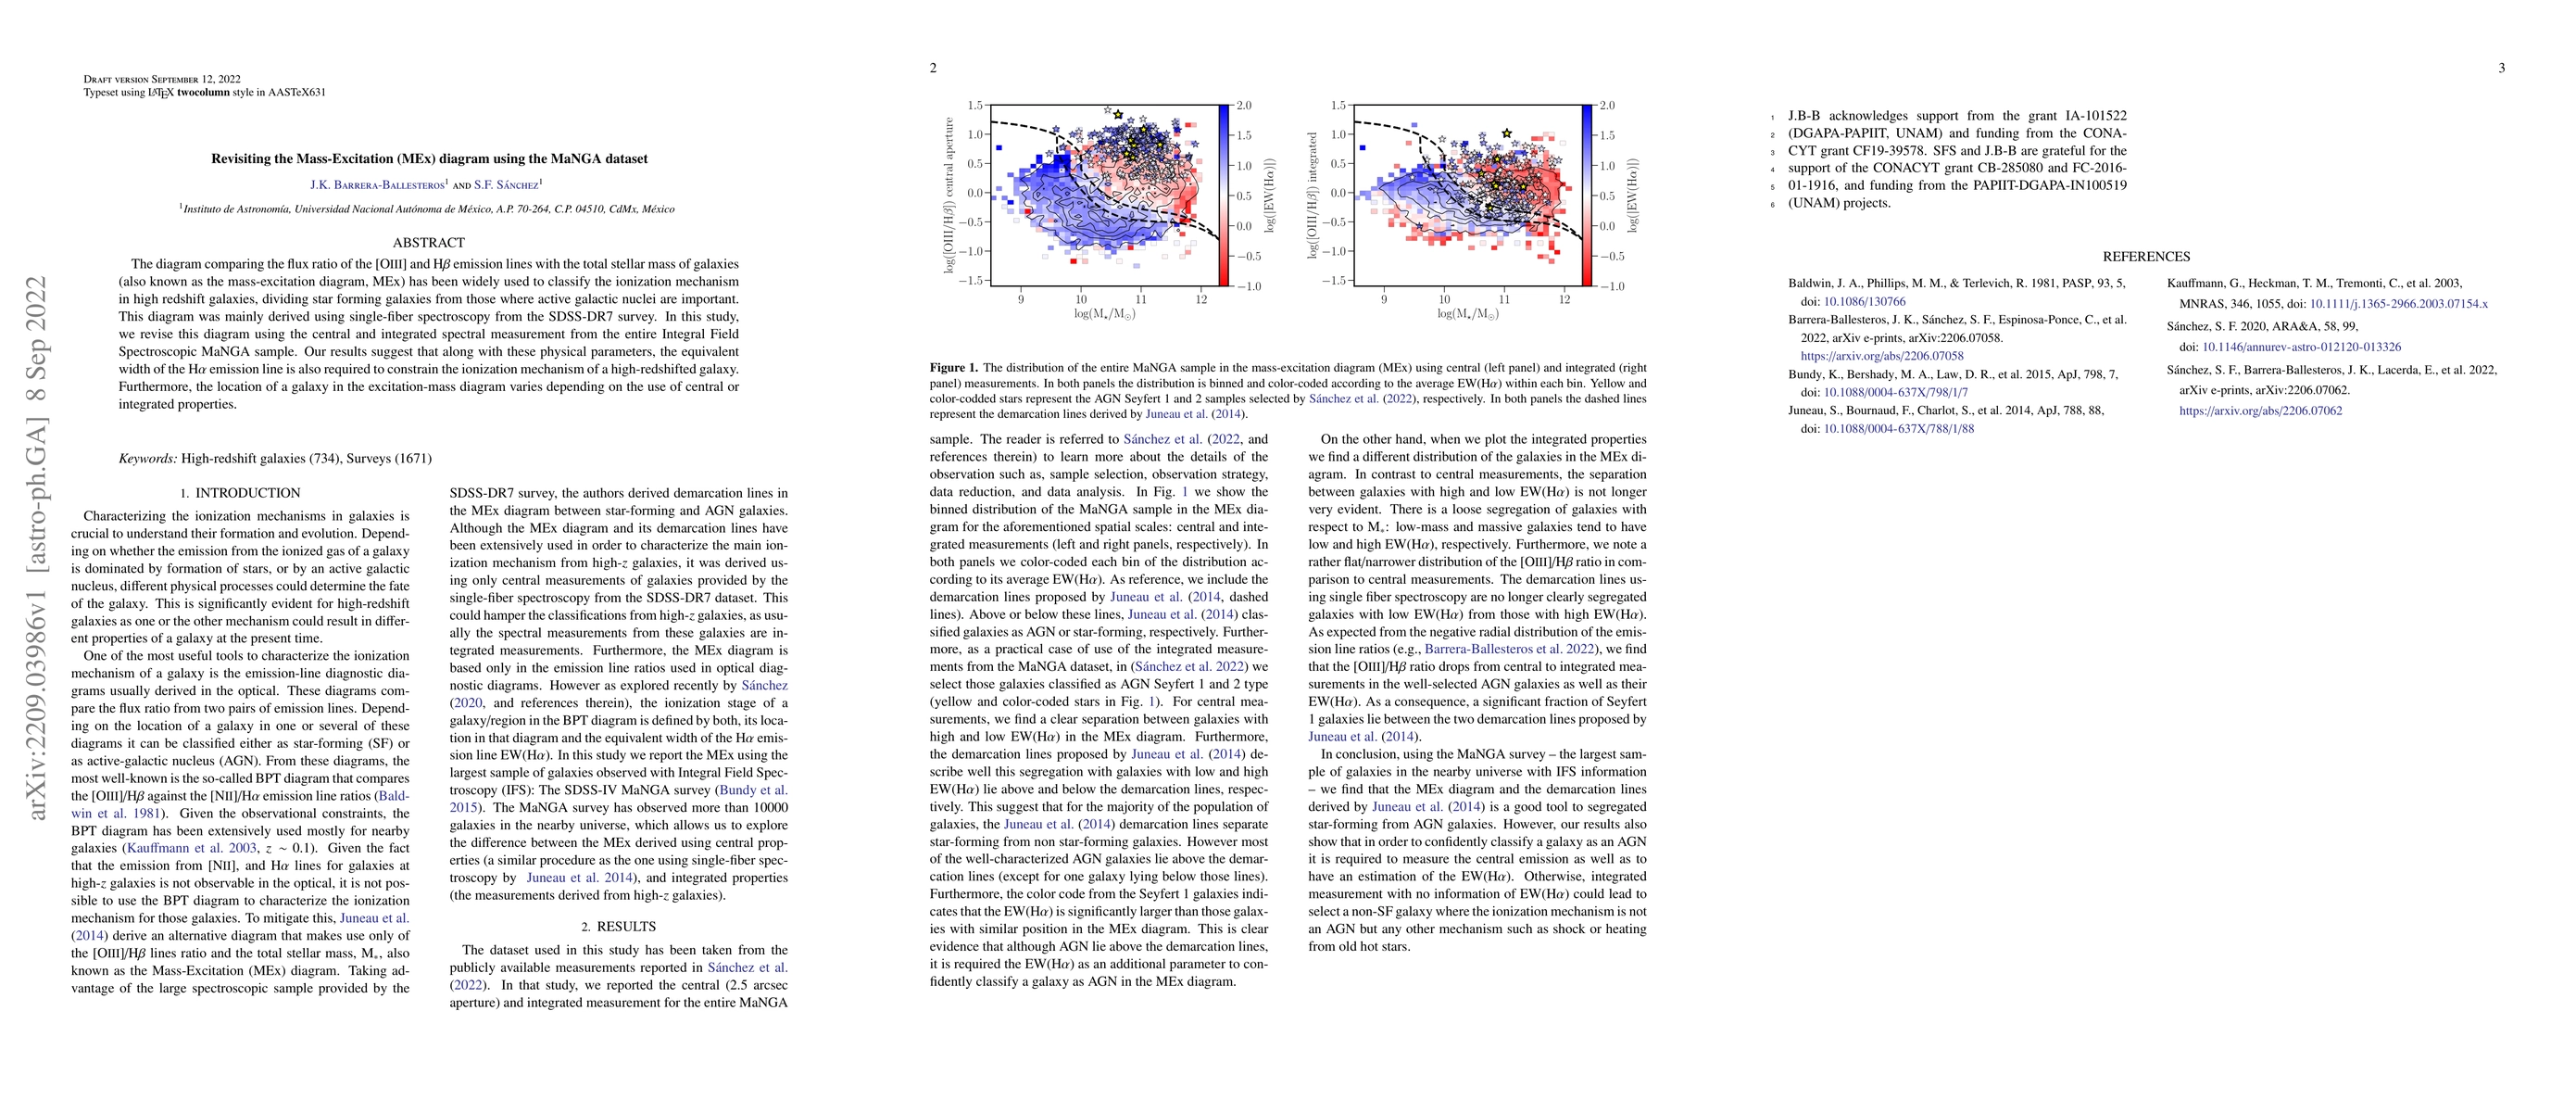
The diagram comparing the flux ratio of the [OIII] and H$\beta$ emission lines with the total stellar mass of galaxies (also known as the mass-excitation diagram, MEx) has been widely used to classify the ionization mechanism in high redshift galaxies between star formation and active galactic nuclear ones. This diagram was mainly derived using single-fiber spectroscopy from the SDSS-DR7 survey. In this study, we revise this diagram using the central and integrated spectral measurement from the entire Integral Field Spectroscopic MaNGA sample. Our results suggest that along with the physical parameters of this diagram, the equivalent width of the H$\alpha$ emission line is also required to constrain the ionization mechanism of a high-redshifted galaxy. Furthermore, the location of a galaxy in the excitation-mass diagram varies depending on the use of central or integrated properties.
AI Key Findings
Get AI-generated insights about this paper's methodology, results, significance, and more — seven facets brought into focus.
Impact
Paper Details
Authors
PDF Preview
Key Terms
Citation Network
Current paper (gray), citations (green), references (blue)
Display is limited for performance on very large graphs.
Discussion 0