RF engineering basic concepts: the Smith chart
1201.4068
CERN Yellow Report CERN-2011-007, pp. 95-116
Published Jan 20, 2012
16 citations
Publication
Published:
Jan 20, 2012
Updated:
Jun 02, 2025
Categories:
physics.acc-ph
Metrics
Citations:
16
Source:
ArXiv
Paper Preview
Abstract
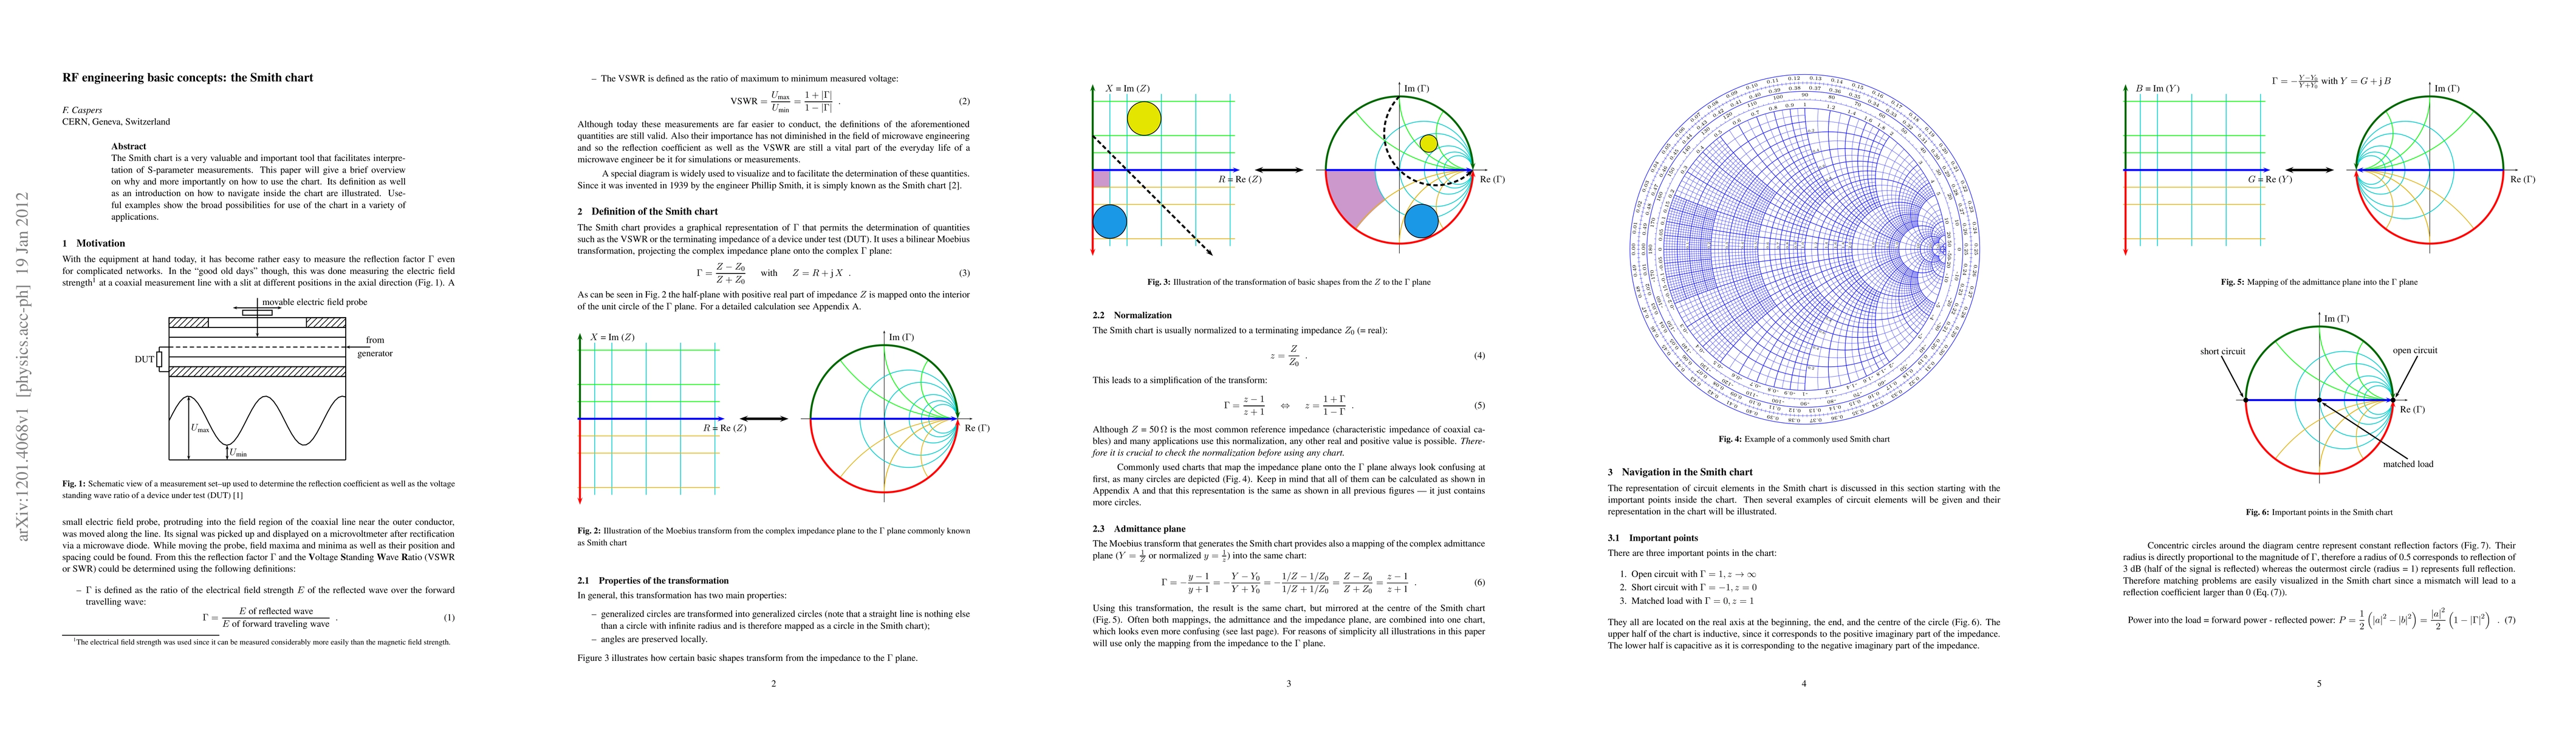
The Smith chart is a very valuable and important tool that facilitates interpretation of S-parameter measurements. This paper will give a brief overview on why and more importantly on how to use the chart. Its definition as well as an introduction on how to navigate inside the chart are illustrated. Useful examples show the broad possibilities for use of the chart in a variety of applications.
AI Key Findings
Get AI-generated insights about this paper's methodology, results, significance, and more — seven facets brought into focus.
Impact
16
Citations
4
References
Paper Details
Paper ID:
1201.4068
Journal:
CERN Yellow Report CERN-2011-007, pp. 95-116
License:
http://creativecommons.org/licenses/by/3.0/
Comments:
22 pages, contribution to the CAS - CERN Accelerator School:
Specialised Course on RF for Accelerators; 8 - 17 Jun 2010, Ebeltoft, Denmark
Categories:
physics.acc-ph
PDF Preview
Key Terms
facilitates
(0.269)
possibilities
(0.269)
brief
(0.261)
importantly
(0.252)
introduction
(0.248)
illustrated
(0.246)
valuable
(0.245)
overview
(0.235)
Citation Network
Current paper (gray), citations (green), references (blue)
Display is limited for performance on very large graphs.
Current Paper
Citations
References
Click to view
Discussion 0