Rhythmic segment analysis: Conceptualizing, visualizing, and measuring rhythmic data
Publication
Metrics
Paper Preview
Abstract
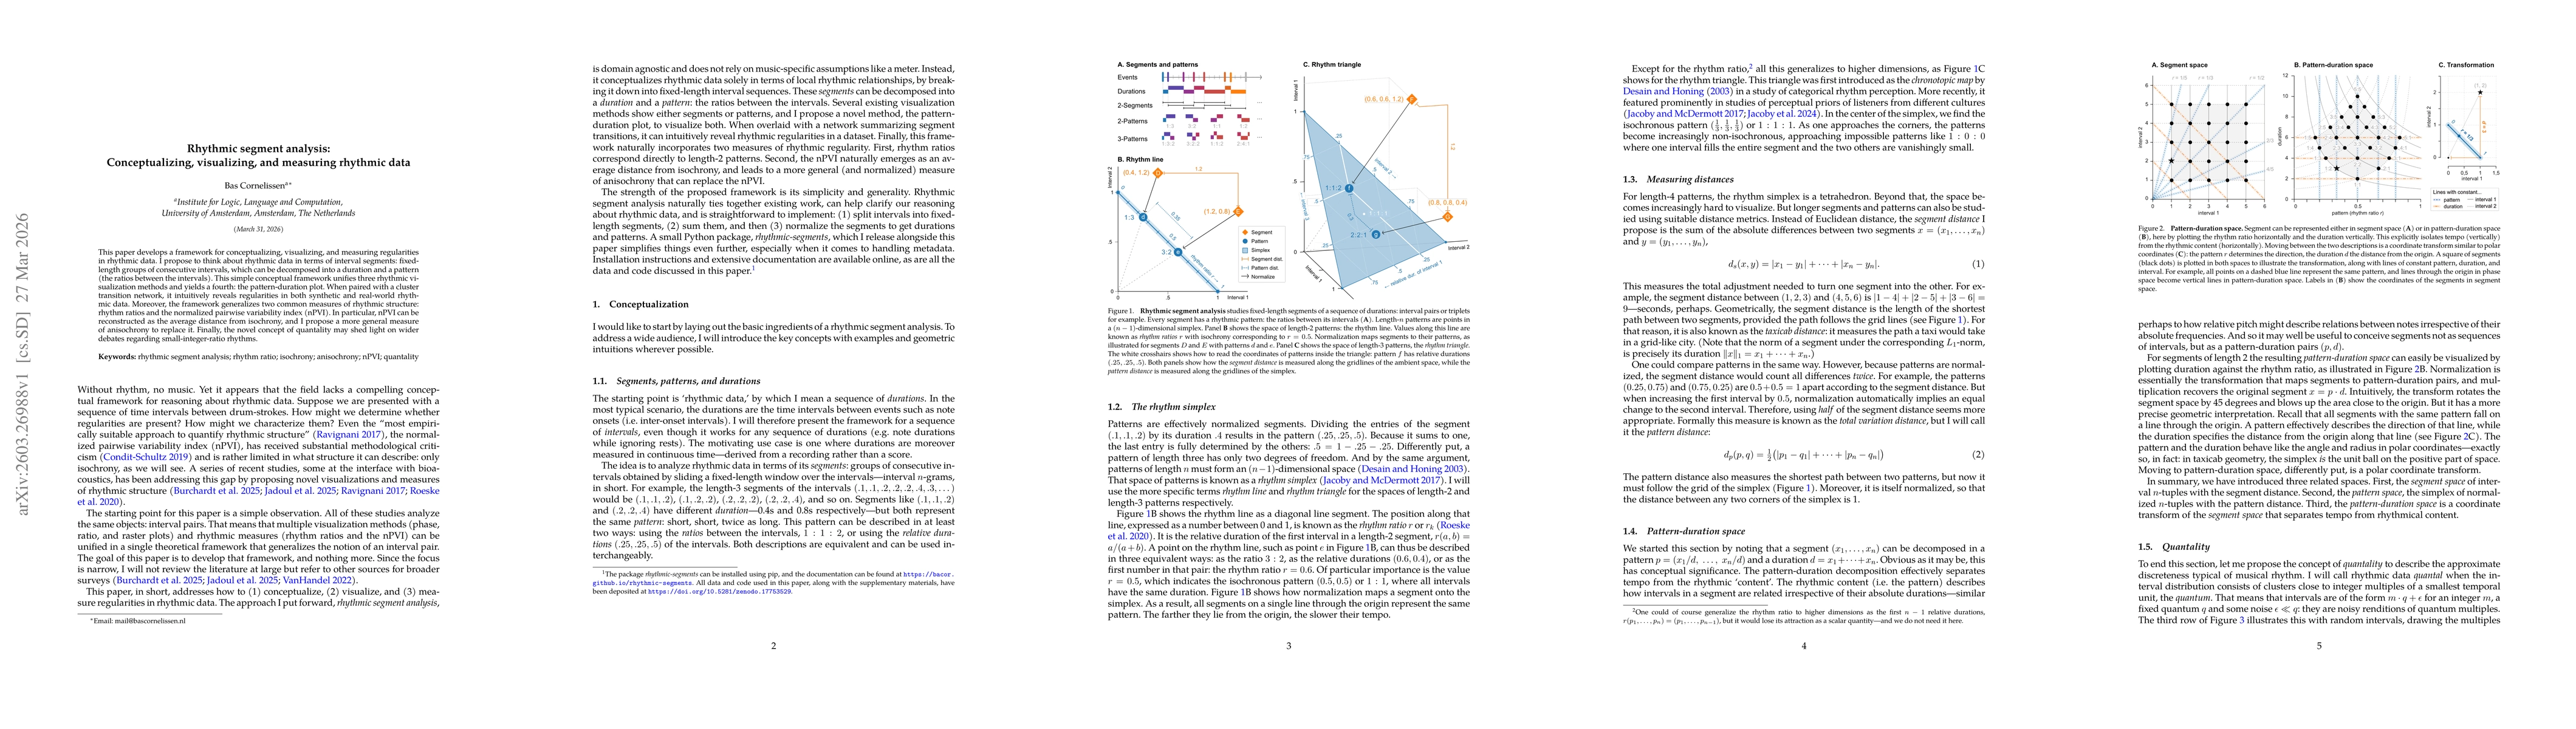
This paper develops a framework for conceptualizing, visualizing, and measuring regularities in rhythmic data. I propose to think about rhythmic data in terms of interval segments: fixed-length groups of consecutive intervals, which can be decomposed into a duration and a pattern (the ratios between the intervals). This simple conceptual framework unifies three rhythmic visualization methods and yields a fourth: the pattern-duration plot. When paired with a cluster transition network, it intuitively reveals regularities in both synthetic and real-world rhythmic data. Moreover, the framework generalizes two common measures of rhythmic structure: rhythm ratios and the normalized pairwise variability index (nPVI). In particular, nPVI can be reconstructed as the average distance from isochrony, and I propose a more general measure of anisochrony to replace it. Finally, the novel concept of quantality may shed light on wider debates regarding small-integer-ratio rhythms.
AI Key Findings
Get AI-generated insights about this paper's methodology, results, significance, and more — seven facets brought into focus.
Discussion 0