Quick Summary:

RMExplorer provides an interactive visualization system for assessing the performance and fairness of disease risk models across patient subgroups. It enables researchers to define subgroups and explore model biases, demonstrated through a case study on atrial fibrillation risk models applied to the UK Biobank dataset.

Summary

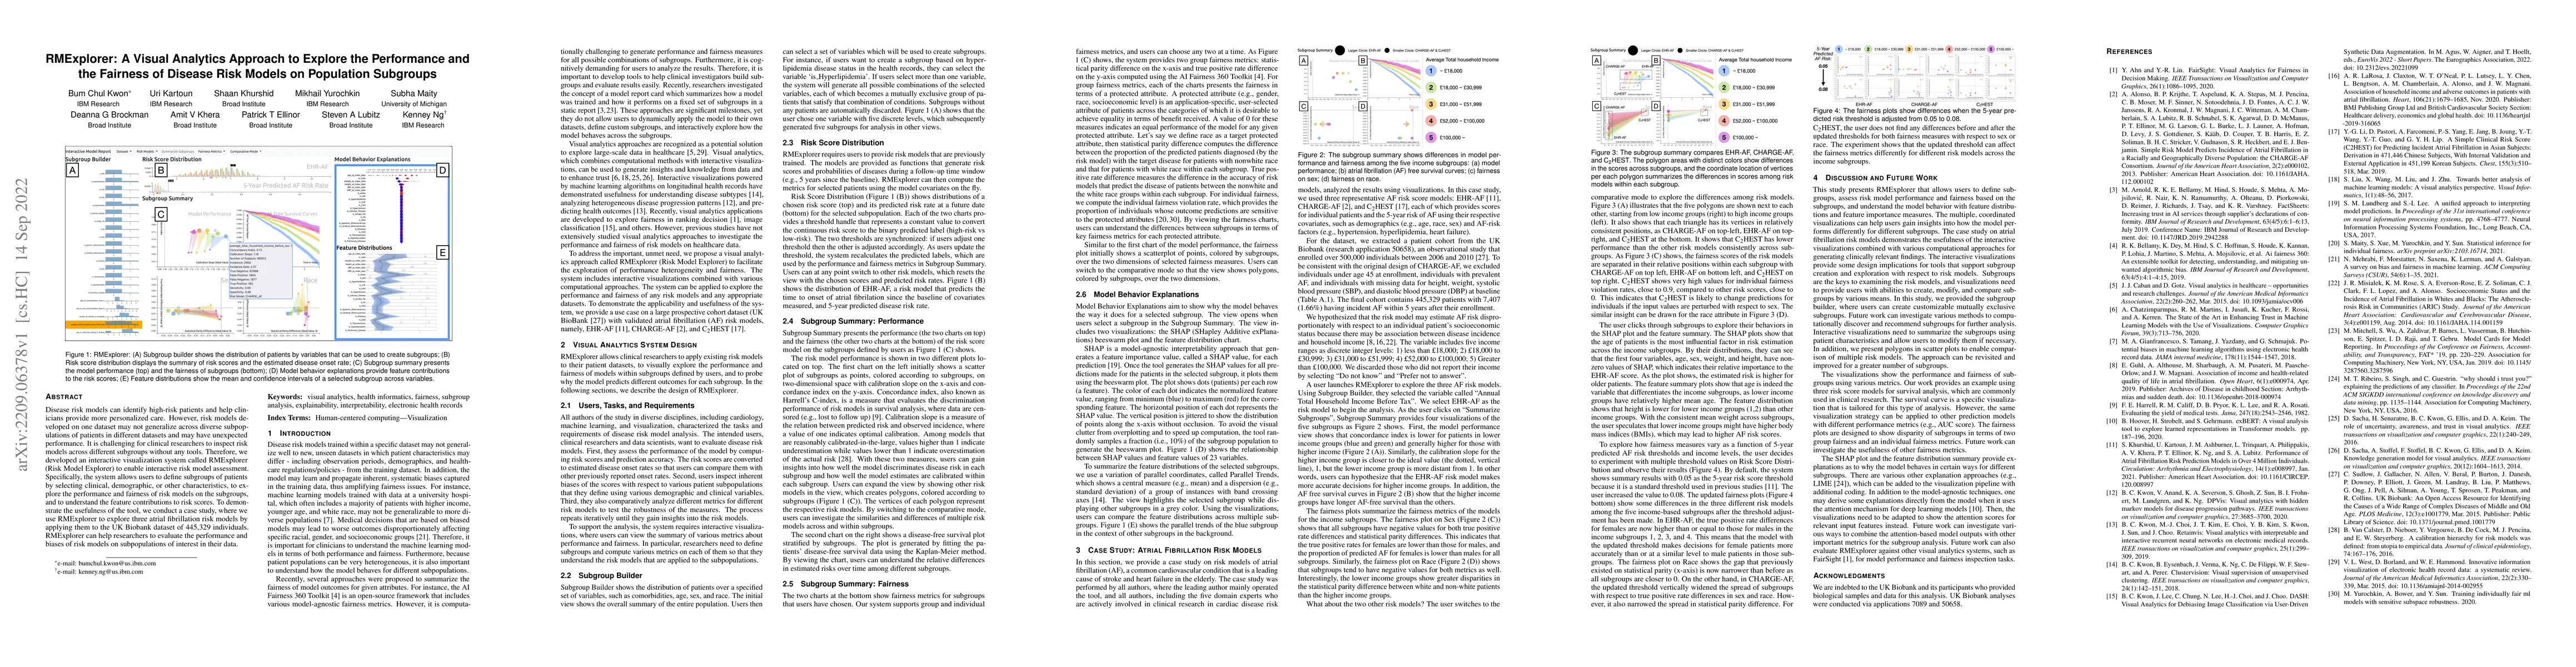
Disease risk models can identify high-risk patients and help clinicians provide more personalized care. However, risk models developed on one dataset may not generalize across diverse subpopulations of patients in different datasets and may have unexpected performance. It is challenging for clinical researchers to inspect risk models across different subgroups without any tools. Therefore, we developed an interactive visualization system called RMExplorer (Risk Model Explorer) to enable interactive risk model assessment. Specifically, the system allows users to define subgroups of patients by selecting clinical, demographic, or other characteristics, to explore the performance and fairness of risk models on the subgroups, and to understand the feature contributions to risk scores. To demonstrate the usefulness of the tool, we conduct a case study, where we use RMExplorer to explore three atrial fibrillation risk models by applying them to the UK Biobank dataset of 445,329 individuals. RMExplorer can help researchers to evaluate the performance and biases of risk models on subpopulations of interest in their data.

AI Key Findings

Get AI-generated insights about this paper's methodology, results, and significance.

Paper Details

PDF Preview

Download PDF

Key Terms

risk (0.377)
risk (0.369)
subgroups (0.292)
subgroups (0.289)
patients (0.278)
patients (0.265)
interactive (0.231)
interactive (0.231)
clinical (0.213)
clinical (0.205)
researchers (0.196)
researchers (0.195)
help (0.172)
help (0.169)
models (0.164)
models (0.164)
explore (0.158)
explore (0.155)
dataset (0.150)
dataset (0.150)

Citation Network

Current paper (gray), citations (green), references (blue)

Current Paper
Citations
References
Click to view
Title Authors Year Actions
Divisi: Interactive Search and Visualization for Scalable Exploratory Subgroup Analysis
Venkatesh Sivaraman, Zexuan Li, Adam Perer
2025
View Paper
Atlas of AI Risks: Enhancing Public Understanding of AI Risks
E. Bogucka, S. Šćepanović, Daniele Quercia
2024
View Paper
DITTO: A Visual Digital Twin for Interventions and Temporal Treatment Outcomes in Head and Neck Cancer
A. Wentzel, Serageldin K Attia, Xinhua Zhang, G. Canahuate, C. Fuller, G. Marai
2024
View Paper
CausalPrism: A Visual Analytics Approach for Subgroup-based Causal Heterogeneity Exploration
Jiehui Zhou, Xumeng Wang, Wong Kam-Kwai, Wei Zhang, Xingyu Liu, Juntian Zhang, Minfeng Zhu, Wei Chen
2024
View Paper
Exploring Visualization for Fairness in AI Education
Xinyuan Yan, Youjia Zhou, Arul Mishra, Himanshu Mishra, Bei Wang
2024
View Paper
Latent Space Explorer: Visual Analytics for Multimodal Latent Space Exploration
Bum Chul Kwon, S. Friedman, Kai Xu, S. Lubitz, A. Philippakis, P. Batra, P. Ellinor, Kenney Ng
2023
View Paper
ProtoExplorer: Interpretable forensic analysis of deepfake videos using prototype exploration and refinement
M. D. L. D. Bouter, J. Pardo, Z. Geradts, M. Worring
2023
View Paper
V: Visual Aids for Identifying and Interpreting Spurious Associations in Data-Driven Decisions
Xian Teng, Yongsu Ahn, Y. Lin
2023
View Paper
Visual Analytics for Machine Learning: A Data Perspective Survey
Junpeng Wang, Shixia Liu, Wei Zhang
2023
View Paper
Finspector: A Human-Centered Visual Inspection Tool for Exploring and Comparing Biases among Foundation Models
Bum Chul Kwon, Nandana Mihindukulasooriya
2023
View Paper
BiasTestGPT: Using ChatGPT for Social Bias Testing of Language Models
Rafal Kocielnik, Shrimai Prabhumoye, Vivian Zhang, R. Alvarez, Anima Anandkumar
2023
View Paper

Comments (0)

This website uses cookies to ensure you get the best experience. Learn more