Roadmap of Designing Cognitive Metrics for Explainable Artificial Intelligence (XAI)
Publication
Metrics
AI Quick Summary
This paper proposes cognitive metrics for evaluating Explainable Artificial Intelligence (XAI) systems based on stakeholders' understanding and attitudes. It outlines seven dimensions—goodness, satisfaction, user understanding, curiosity & engagement, trust & reliance, controllability & interactivity, and learning curve & productivity—and suggests both subjective and objective psychological measures to quantify these aspects and improve XAI systems.
Paper Preview
Abstract
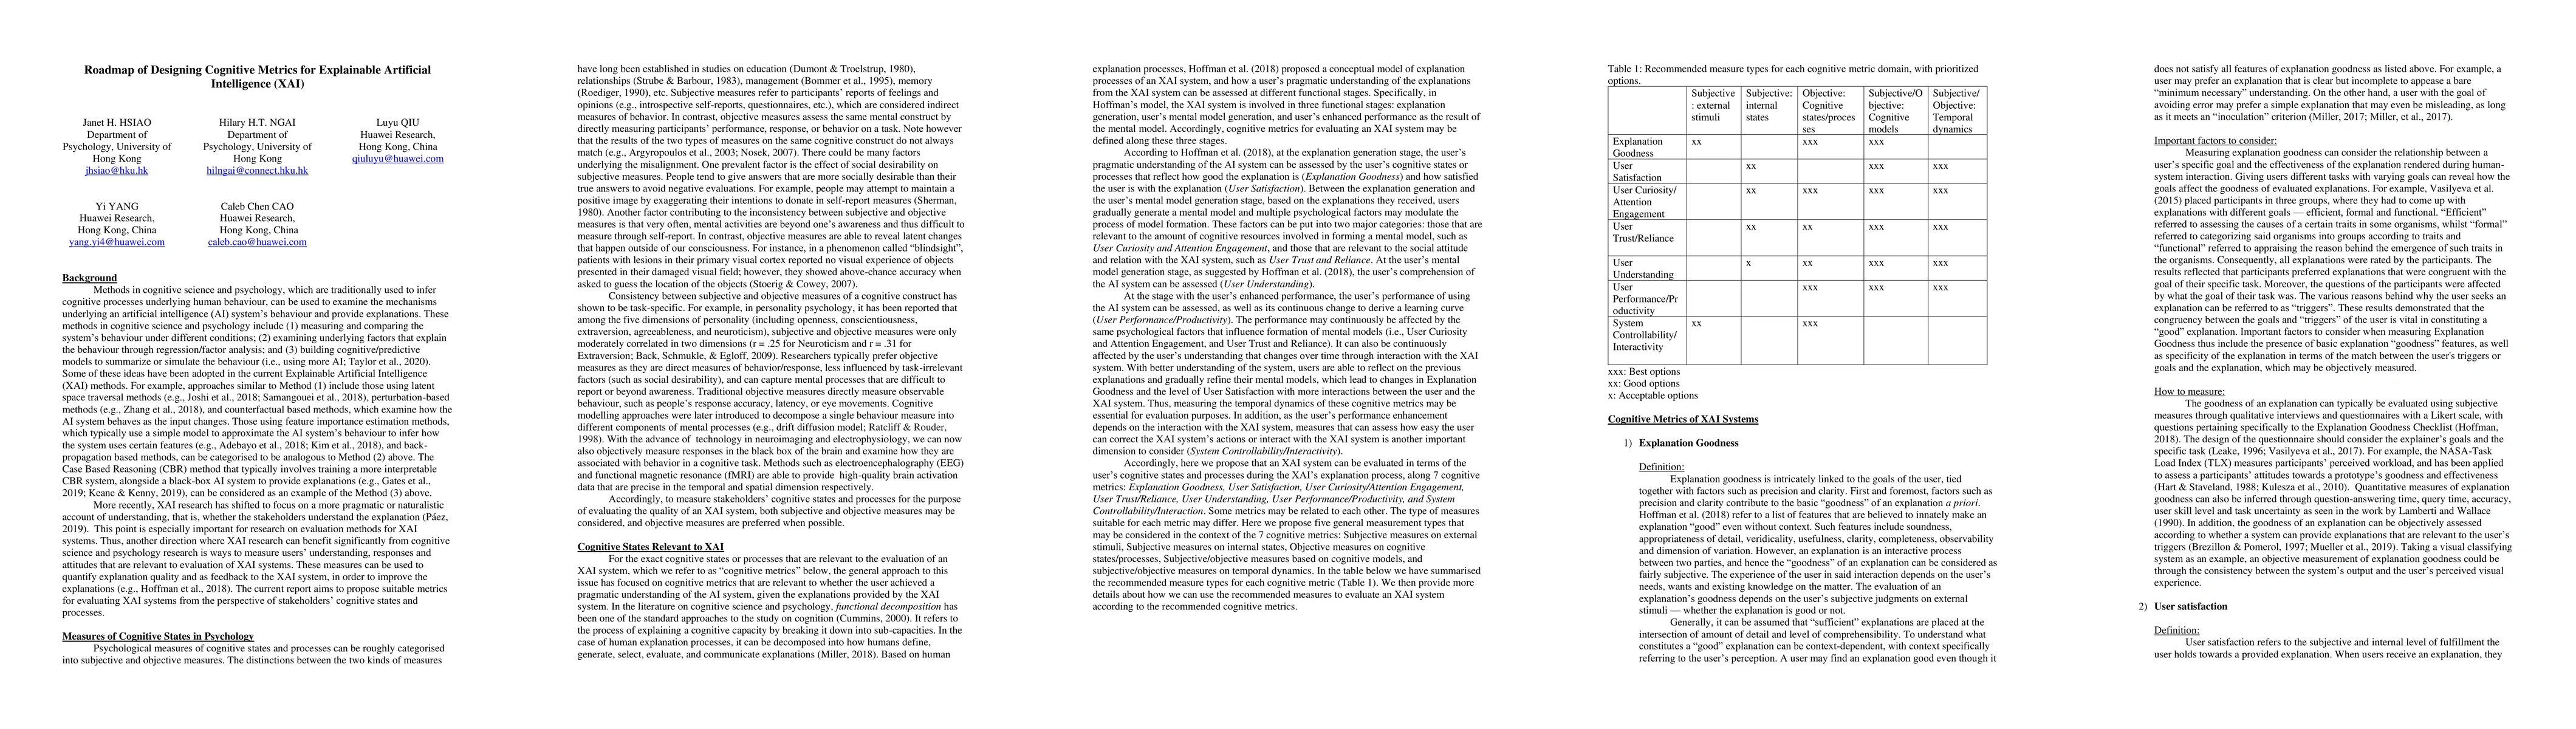
More recently, Explainable Artificial Intelligence (XAI) research has shifted to focus on a more pragmatic or naturalistic account of understanding, that is, whether the stakeholders understand the explanation. This point is especially important for research on evaluation methods for XAI systems. Thus, another direction where XAI research can benefit significantly from cognitive science and psychology research is ways to measure understanding of users, responses and attitudes. These measures can be used to quantify explanation quality and as feedback to the XAI system to improve the explanations. The current report aims to propose suitable metrics for evaluating XAI systems from the perspective of the cognitive states and processes of stakeholders. We elaborate on 7 dimensions, i.e., goodness, satisfaction, user understanding, curiosity & engagement, trust & reliance, controllability & interactivity, and learning curve & productivity, together with the recommended subjective and objective psychological measures. We then provide more details about how we can use the recommended measures to evaluate a visual classification XAI system according to the recommended cognitive metrics.
AI Key Findings
Get AI-generated insights about this paper's methodology, results, significance, and more — seven facets brought into focus.
Impact
Paper Details
Authors
PDF Preview
Key Terms
Citation Network
Current paper (gray), citations (green), references (blue)
Display is limited for performance on very large graphs.
Discussion 0