Publication
Metrics
AI Quick Summary
RobPy is a Python package providing a comprehensive suite of robust statistical methods for outlier detection and analysis, leveraging NumPy, SciPy, and scikit-learn. It aims to offer tools for robust preprocessing, regression, and diagnostic visualization, enhancing data analysis reliability in the presence of anomalous data.
Paper Preview
Abstract
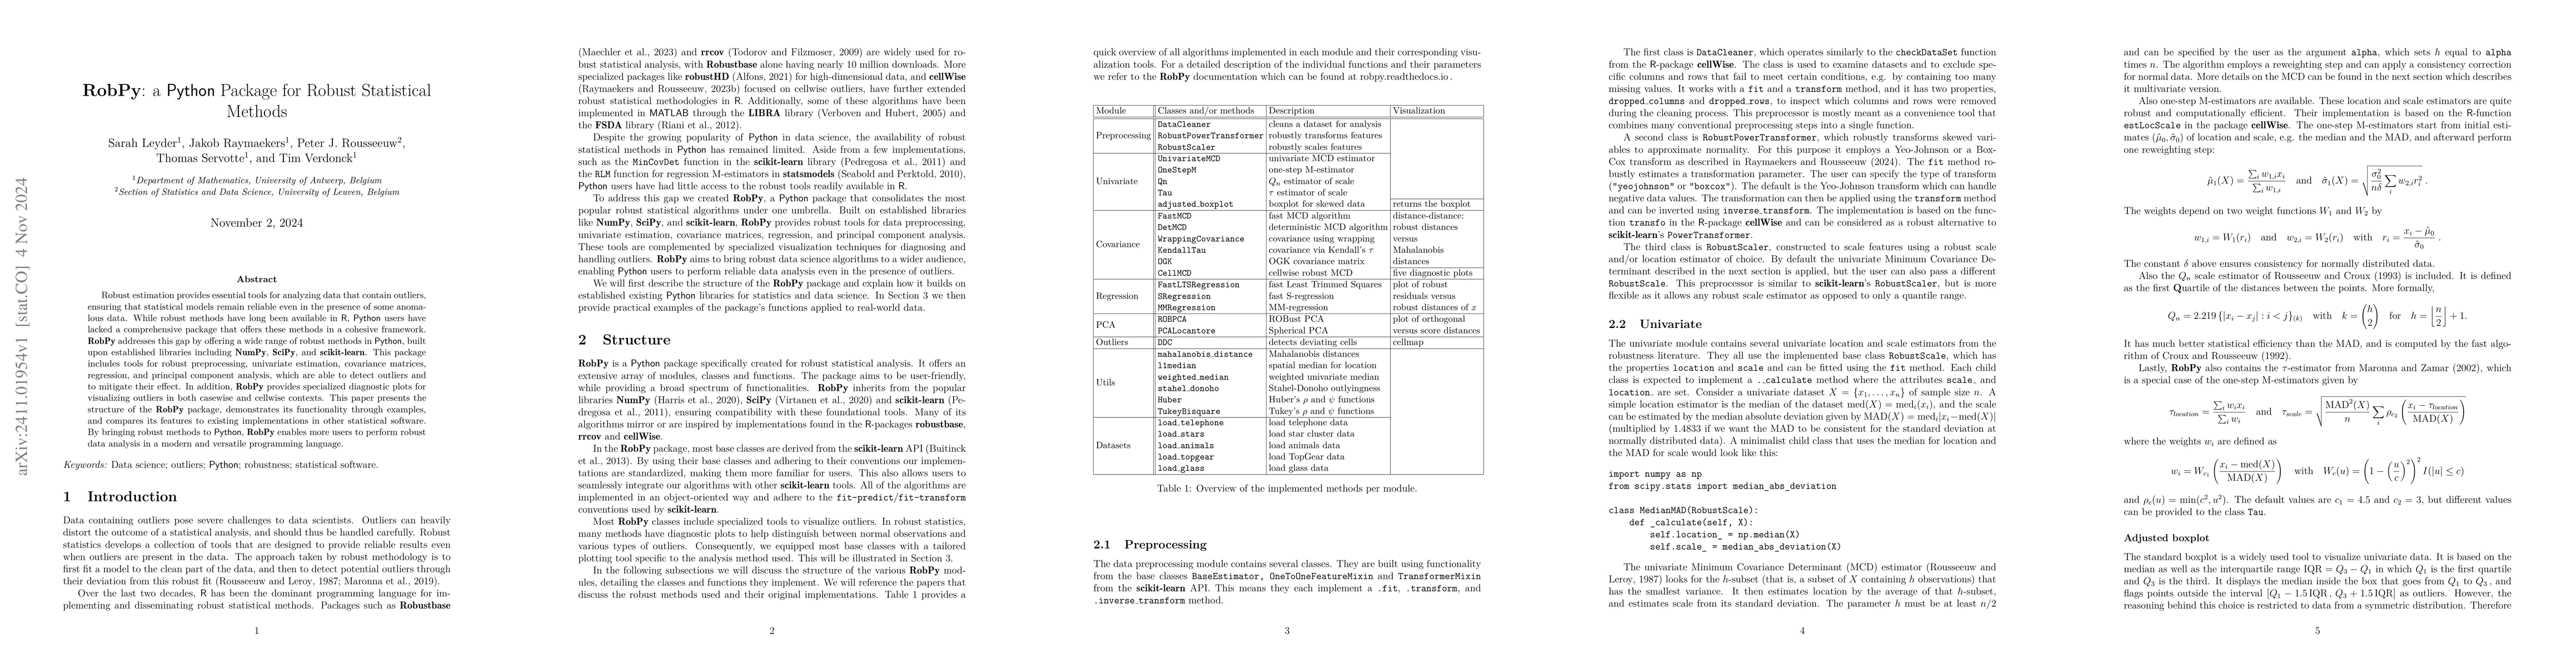
Robust estimation provides essential tools for analyzing data that contain outliers, ensuring that statistical models remain reliable even in the presence of some anomalous data. While robust methods have long been available in R, users of Python have lacked a comprehensive package that offers these methods in a cohesive framework. RobPy addresses this gap by offering a wide range of robust methods in Python, built upon established libraries including NumPy, SciPy, and scikit-learn. This package includes tools for robust preprocessing, univariate estimation, covariance matrices, regression, and principal component analysis, which are able to detect outliers and to mitigate their effect. In addition, RobPy provides specialized diagnostic plots for visualizing casewise and cellwise outliers. This paper presents the structure of the RobPy package, demonstrates its functionality through examples, and compares its features to existing implementations in other statistical software. By bringing robust methods to Python, RobPy enables more users to perform robust data analysis in a modern and versatile programming language.
AI Key Findings
Get AI-generated insights about this paper's methodology, results, significance, and more — seven facets brought into focus.
Impact
Authors
PDF Preview
Citation Network
Current paper (gray), citations (green), references (blue)
Display is limited for performance on very large graphs.
Discussion 0