Summary
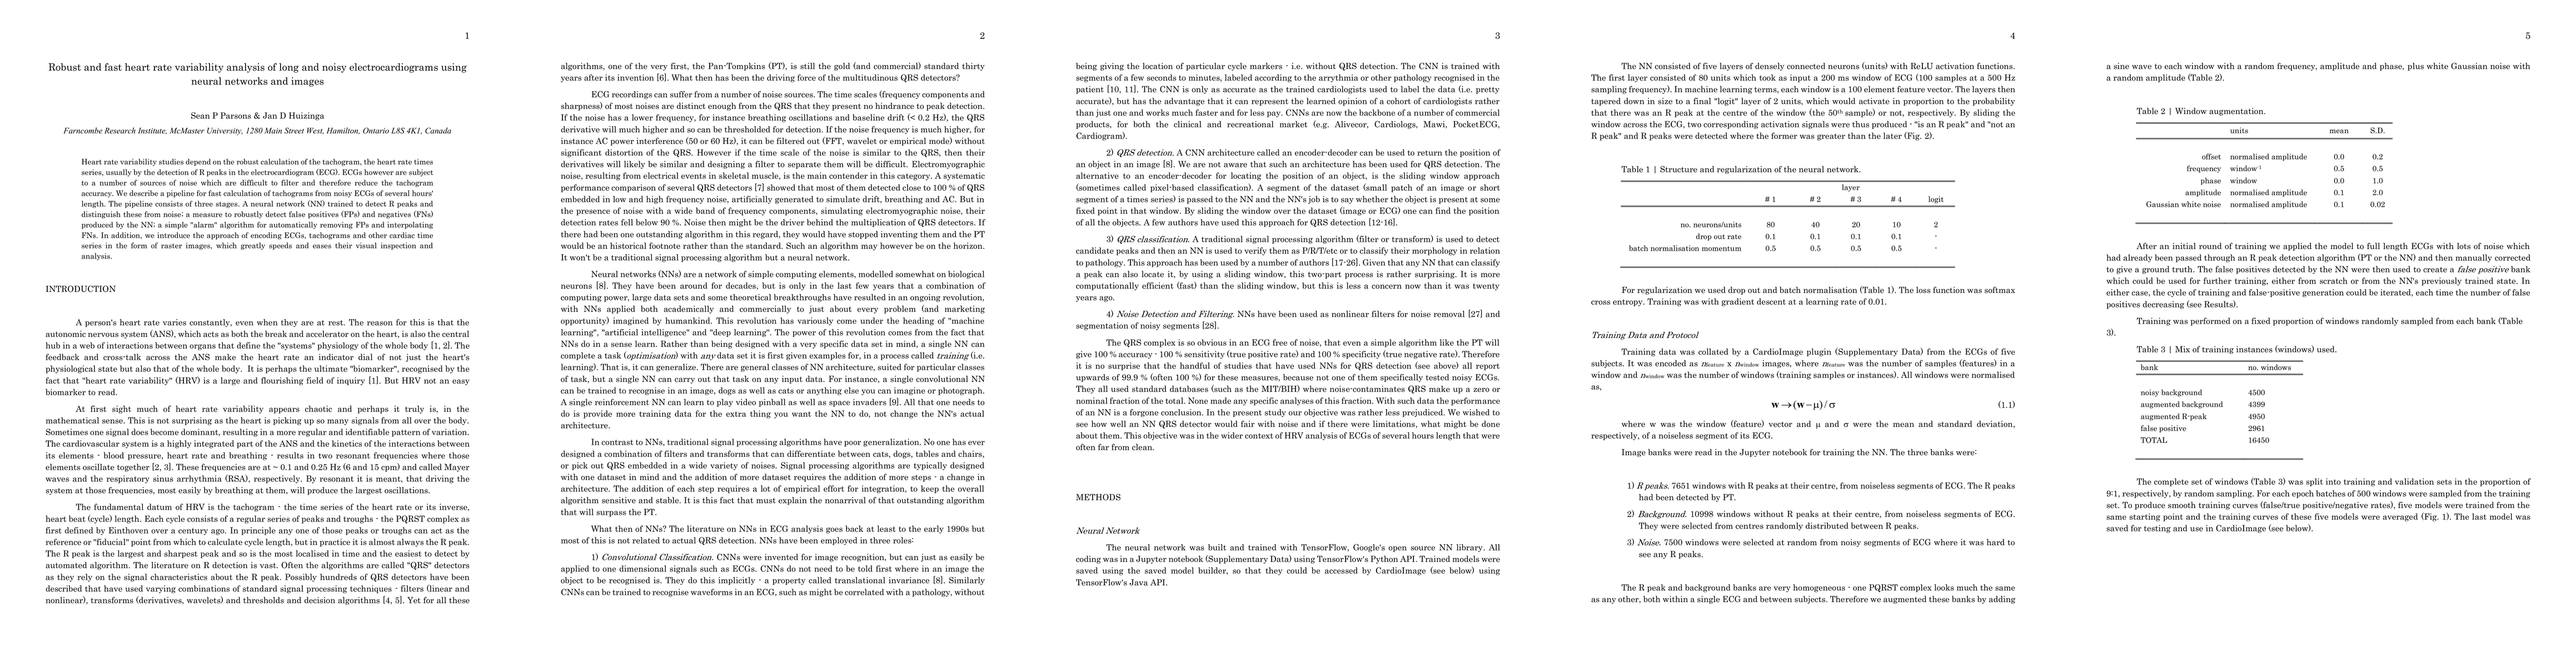
Heart rate variability studies depend on the robust calculation of the tachogram, the heart rate times series, usually by the detection of R peaks in the electrocardiogram (ECG). ECGs however are subject to a number of sources of noise which are difficult to filter and therefore reduce the tachogram accuracy. We describe a pipeline for fast calculation of tachograms from noisy ECGs of several hours' length. The pipeline consists of three stages. A neural network (NN) trained to detect R peaks and distinguish these from noise; a measure to robustly detect false positives (FPs) and negatives (FNs) produced by the NN; a simple "alarm" algorithm for automatically removing FPs and interpolating FNs. In addition, we introduce the approach of encoding ECGs, tachograms and other cardiac time series in the form of raster images, which greatly speeds and eases their visual inspection and analysis.
AI Key Findings
Get AI-generated insights about this paper's methodology, results, and significance.
Paper Details
PDF Preview
Key Terms
Citation Network
Current paper (gray), citations (green), references (blue)
Display is limited for performance on very large graphs.
Similar Papers
Found 4 papers| Title | Authors | Year | Actions |
|---|
Comments (0)