Robust Bayesian Graphical Regression Models for Assessing Tumor Heterogeneity in Proteomic Networks
Publication
Metrics
AI Quick Summary
This paper proposes robust Bayesian graphical regression (rBGR) to model heterogeneous proteomic networks in cancer, addressing the limitations of existing models by accommodating non-normal data and tumor heterogeneity. The rBGR framework uses random transformations and graphical regression to construct covariate-dependent graphs, revealing differential protein-protein interactions influenced by immune cell abundance in lung and ovarian cancers.
Paper Preview
Abstract
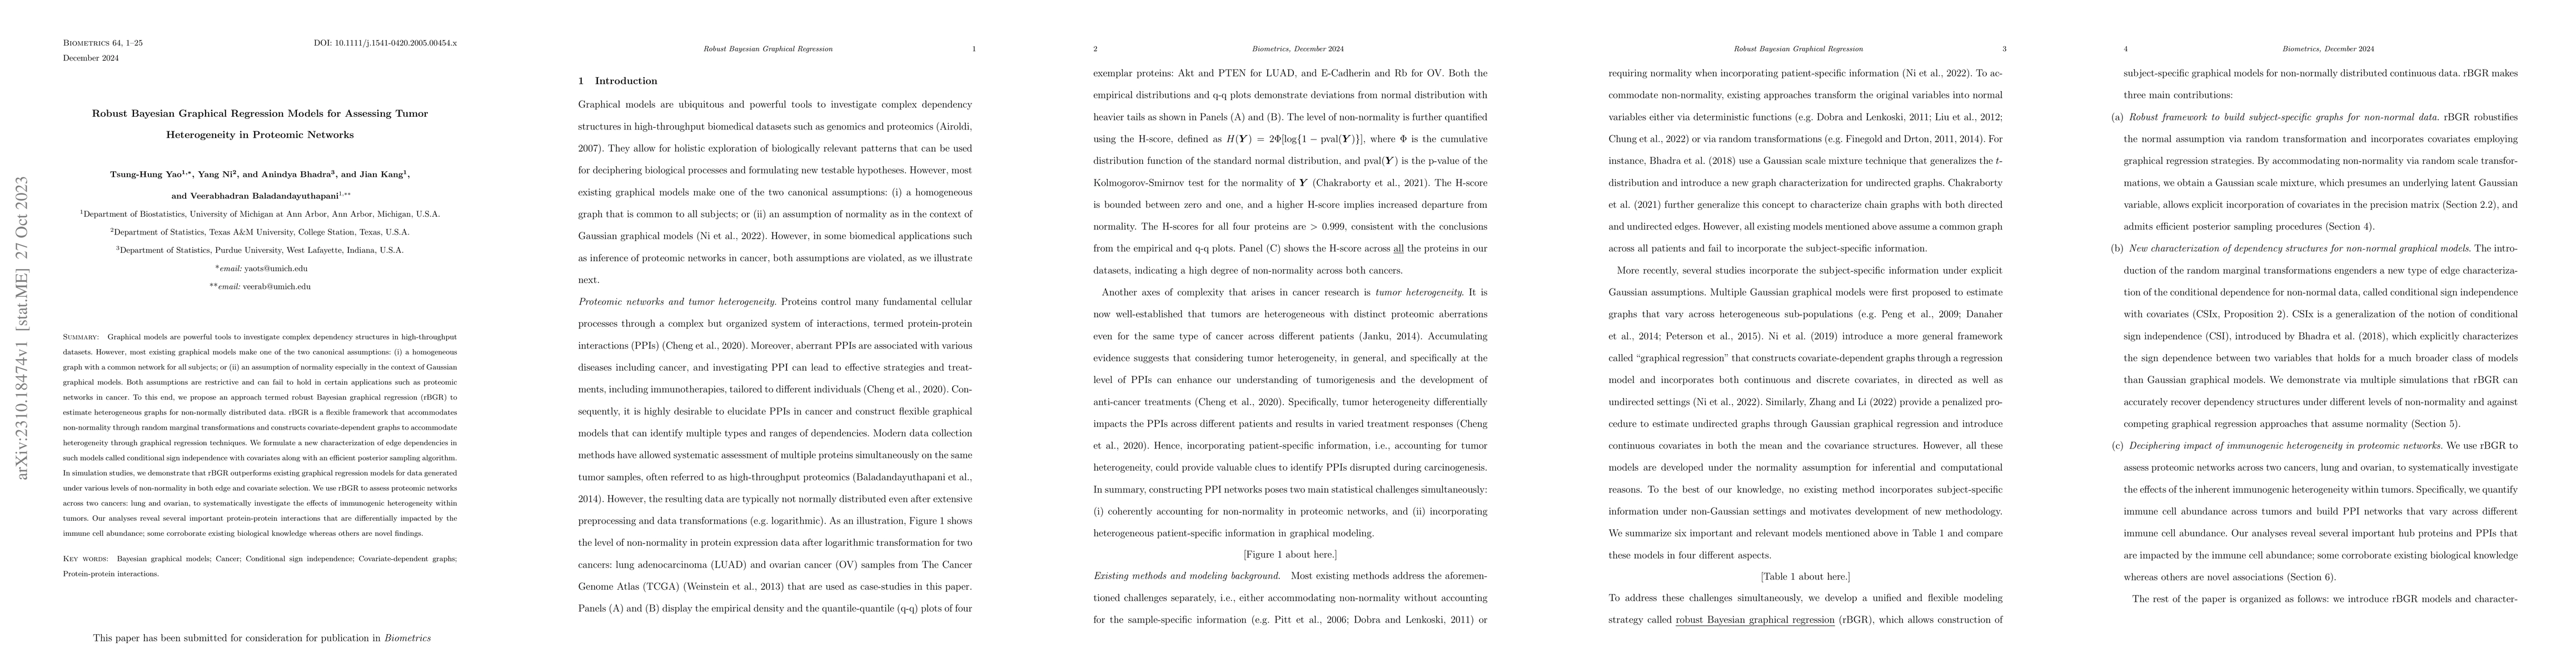
Graphical models are powerful tools to investigate complex dependency structures in high-throughput datasets. However, most existing graphical models make one of the two canonical assumptions: (i) a homogeneous graph with a common network for all subjects; or (ii) an assumption of normality especially in the context of Gaussian graphical models. Both assumptions are restrictive and can fail to hold in certain applications such as proteomic networks in cancer. To this end, we propose an approach termed robust Bayesian graphical regression (rBGR) to estimate heterogeneous graphs for non-normally distributed data. rBGR is a flexible framework that accommodates non-normality through random marginal transformations and constructs covariate-dependent graphs to accommodate heterogeneity through graphical regression techniques. We formulate a new characterization of edge dependencies in such models called conditional sign independence with covariates along with an efficient posterior sampling algorithm. In simulation studies, we demonstrate that rBGR outperforms existing graphical regression models for data generated under various levels of non-normality in both edge and covariate selection. We use rBGR to assess proteomic networks across two cancers: lung and ovarian, to systematically investigate the effects of immunogenic heterogeneity within tumors. Our analyses reveal several important protein-protein interactions that are differentially impacted by the immune cell abundance; some corroborate existing biological knowledge whereas others are novel findings.
AI Key Findings
Get AI-generated insights about this paper's methodology, results, significance, and more — seven facets brought into focus.
Impact
Paper Details
Authors
PDF Preview
Key Terms
Citation Network
Current paper (gray), citations (green), references (blue)
Display is limited for performance on very large graphs.
Discussion 0