Authors
Summary
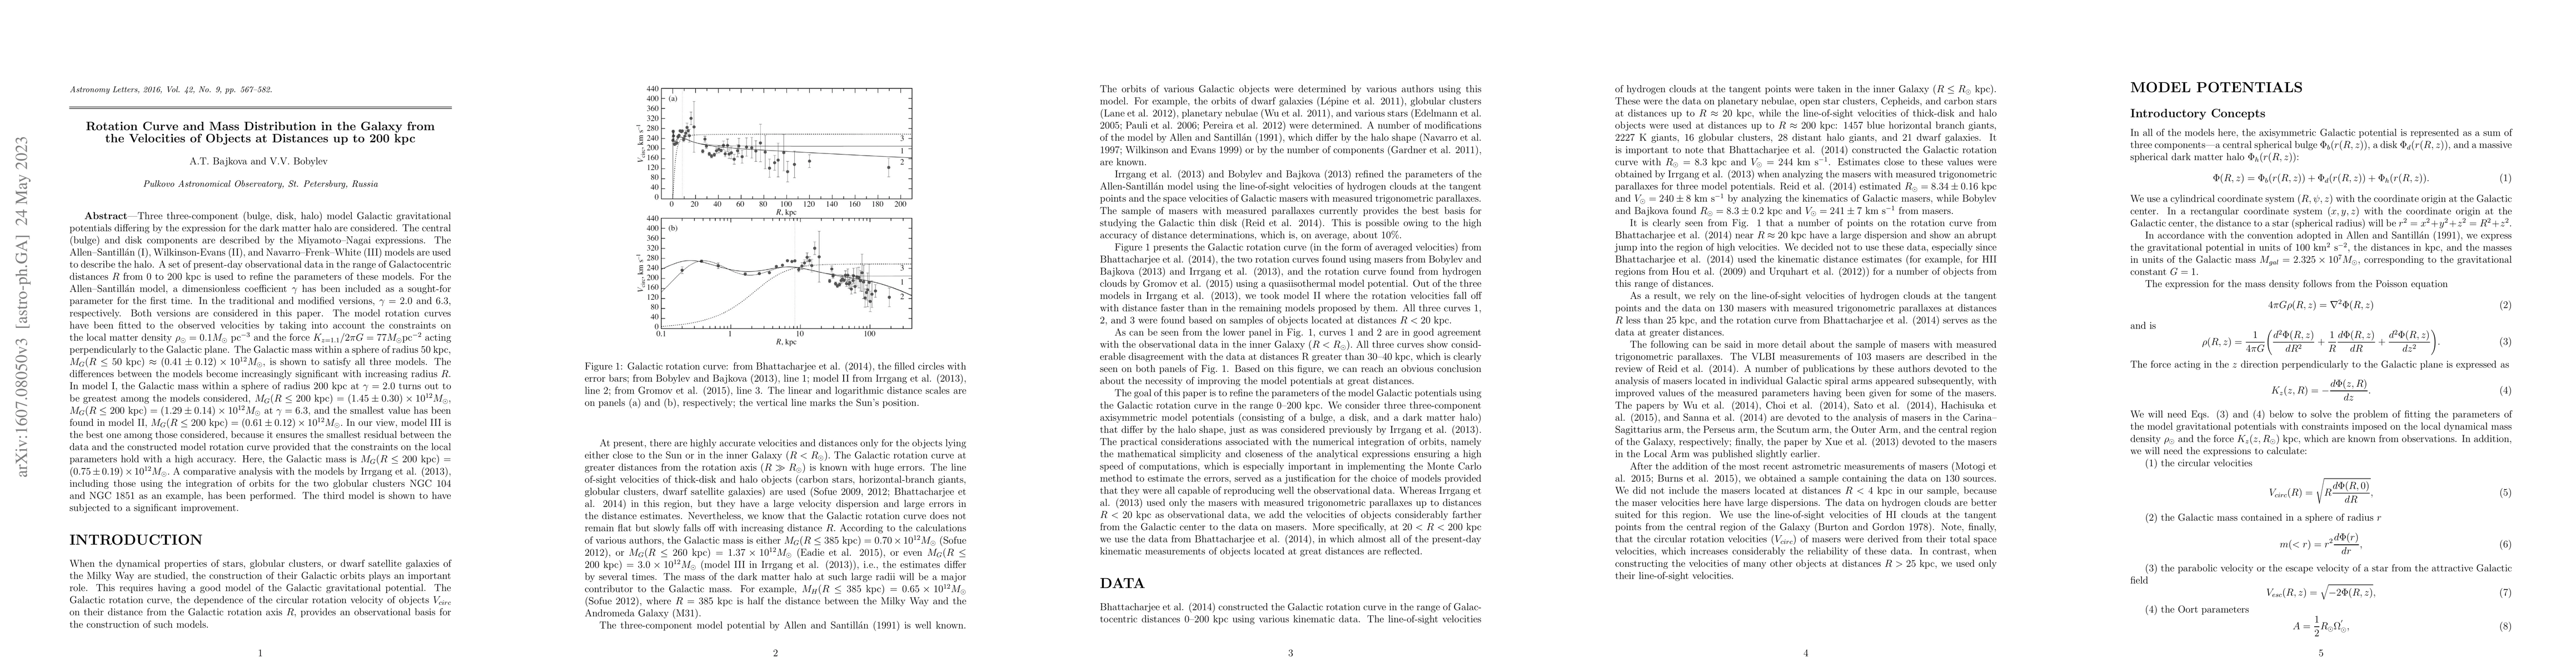
Three three-component (bulge, disk, halo) model Galactic gravitational potentials differing by the expression for the dark matter halo are considered. The central (bulge) and disk components are described by the Miyamoto-Nagai expressions. The Allen-Santill'an (I), Wilkinson-Evans (II), and Navarro-Frenk-White (III) models are used to describe the halo. A set of present-day observational data in the range of Galactocentric distances R from 0 to 200 kpc is used to refine the parameters of these models. The model rotation curves have been fitted to the observed velocities by taking into account the constraints on the local matter density \rho_\odotand the force K_{z=1.1} acting perpendicularly to the Galactic plane. The Galactic mass within a sphere of radius 50 kpc, M_G (R<=50 kpc)=(0.41+/-0.12)x10^12 M_\odot, is shown to satisfy all three models. The differences between the models become increasingly significant with increasing radius R. In model I, the Galactic mass within a sphere of radius 200 kpc turns out to be greatest among the models considered, M_G (R<=200 kpc)=(1.45+/-0.30)x10^12 M_\odot, and the smallest value has been found in model II, M_G (R<=200 kpc)=(0.61+/-0.12)x10^{12} M_\odot. In our view, model III is the best one among those considered, because it ensures the smallest residual between the data and the constructed model rotation curve provided that the constraints on the local parameters hold with a high accuracy. Here, the Galactic mass is M_G (R<=200 kpc)=(0.75+/-0.19)x10^12 M_\odot. A comparative analysis with the models by Irrgang et al. (2013), including those using the integration of orbits for the two globular clusters NGC 104 and NGC 1851 as an example, has been performed. The third model is shown to have subjected to a significant improvement.
AI Key Findings
Get AI-generated insights about this paper's methodology, results, and significance.
Paper Details
PDF Preview
Key Terms
Citation Network
Current paper (gray), citations (green), references (blue)
Display is limited for performance on very large graphs.
Similar Papers
Found 4 papersParameters of Three Selected Model Galactic Potentials Based on the Velocities of Objects at Distances up to 200 kpc
A. T. Bajkova, V. V. Bobylev, A. O. Gromov
The rotation curve and mass distribution of M31
Bingqiu Chen, Jiarui Sun, Zhijia Tian et al.
| Title | Authors | Year | Actions |
|---|
Comments (0)