Quick Summary:

RSATree enables flexible visual query of large-scale tabular datasets with arbitrary queries and user-adjustable granularities, improving data exploration efficiency and utility.

Summary

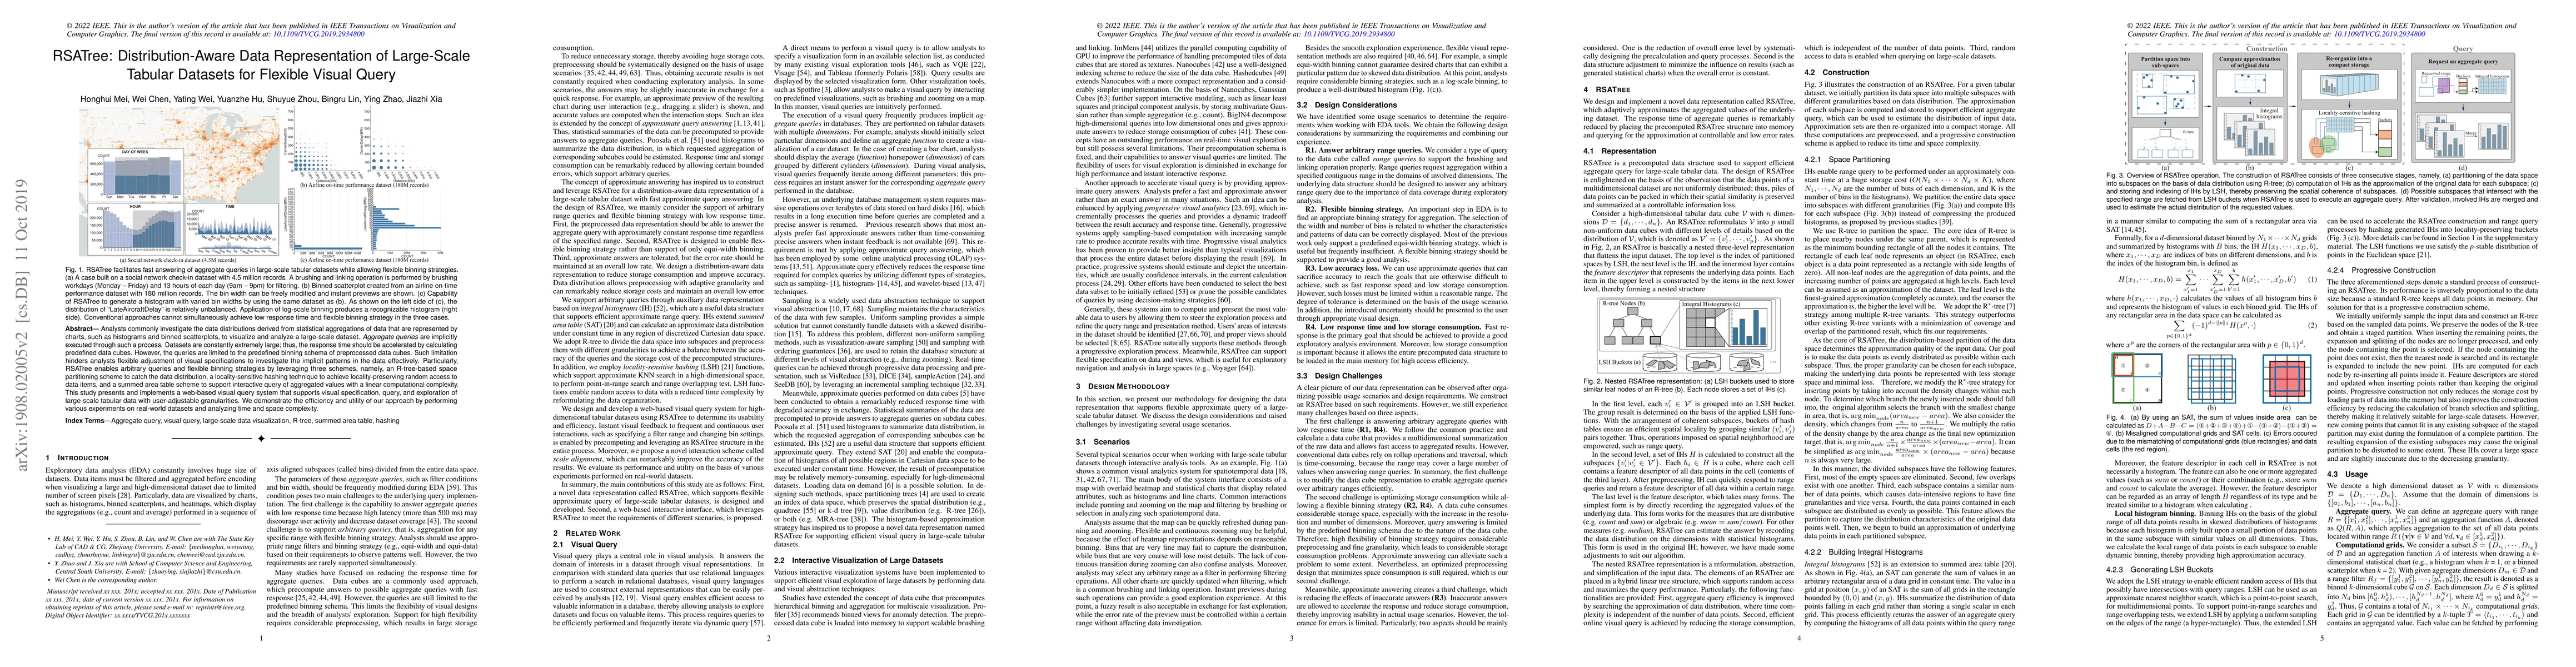
Analysts commonly investigate the data distributions derived from statistical aggregations of data that are represented by charts, such as histograms and binned scatterplots, to visualize and analyze a large-scale dataset. Aggregate queries are implicitly executed through such a process. Datasets are constantly extremely large; thus, the response time should be accelerated by calculating predefined data cubes. However, the queries are limited to the predefined binning schema of preprocessed data cubes. Such limitation hinders analysts' flexible adjustment of visual specifications to investigate the implicit patterns in the data effectively. Particularly, RSATree enables arbitrary queries and flexible binning strategies by leveraging three schemes, namely, an R-tree-based space partitioning scheme to catch the data distribution, a locality-sensitive hashing technique to achieve locality-preserving random access to data items, and a summed area table scheme to support interactive query of aggregated values with a linear computational complexity. This study presents and implements a web-based visual query system that supports visual specification, query, and exploration of large-scale tabular data with user-adjustable granularities. We demonstrate the efficiency and utility of our approach by performing various experiments on real-world datasets and analyzing time and space complexity.

AI Key Findings

Get AI-generated insights about this paper's methodology, results, and significance.

Paper Details

PDF Preview

Download PDF

Key Terms

queries (0.250)
query (0.243)
locality (0.212)
visual (0.207)
flexible (0.176)
data (0.154)
large scale (0.151)
complexity (0.142)
scheme (0.138)
items (0.136)
datasets (0.133)
aggregate (0.130)
partitioning (0.130)
implicitly (0.129)
specification (0.129)
specifications (0.128)
interactive (0.128)
table (0.125)
limitation (0.121)
web (0.119)

Citation Network

Current paper (gray), citations (green), references (blue)

Current Paper
Citations
References
Click to view
Title Authors Year Actions
Sample2SQL: A Visual Interface for Querying Risky Enterprises
Hongjia Wu, Shan-Chen Zou, Jiazhi Xia, Hongxin Zhang, Wei Chen
2024
View Paper
Utilization of extremely precise analytics: A State-of-the-Art Approach and Future Potentials
P. Katrakazas
2022
View Paper
A survey of urban visual analytics: Advances and future directions
Zikun Deng, Di Weng, Shuhan Liu, Yuan Tian, Mingliang Xu, Yingnian Wu
2022
View Paper
A hybrid prediction and search approach for flexible and efficient exploration of big data
Jie Li, Yongjian Sun, Zhenhuan Lei, Siming Chen, G. Andrienko, N. Andrienko, Wei Chen
2022
View Paper
Visualization and visual analysis of multimedia data in manufacturing: A survey
Yunchao Wang, Zihao Zhu, Lei Wang, Guodao Sun, Ronghua Liang
2022
View Paper
A learning-based approach for efficient visualization construction
Yongjian Sun, Jie Li, Siming Chen, G. Andrienko, N. Andrienko, Kang Zhang
2022
View Paper
DDLVis: Real-time Visual Query of Spatiotemporal Data Distribution via Density Dictionary Learning
Chenhui Li, G. Baciu, Yunzhe Wang, Junjie Chen, Changbo Wang
2021
View Paper
iNet: visual analysis of irregular transition in multivariate dynamic networks
Dongming Han, Jiacheng Pan, Rusheng Pan, Dawei Zhou, Nan Cao, Jingrui He, Mingliang Xu, Wei Chen
2021
View Paper
RallyComparator: visual comparison of the multivariate and spatial stroke sequence in table tennis rally
Ji Lan, Jiachen Wang, Xinhuan Shu, Zheng Zhou, Hui Zhang, Yingcai Wu
2021
View Paper
Fine-Grained Visual Computing Based on Deep Learning
Zhihan Lv, Liang Qiao, A. Singh, Qingjun Wang
2021
View Paper
Uncertainty-Oriented Ensemble Data Visualization and Exploration using Variable Spatial Spreading
Mingdong Zhang, Li Chen, Quan Li, Xiaoru Yuan, Junhai Yong
2020
View Paper
A Structured Review of Data Management Technology for Interactive Visualization and Analysis
L. Battle, C. Scheidegger
2020
View Paper
Reverse-engineering bar charts using neural networks
Fangfang Zhou, Yong Zhao, Wenjiang Chen, Yijing Tan, Yaqi Xu, Yi Chen, Chao Liu, Ying Zhao
2020
View Paper
Federated Visualization: A Privacy-Preserving Strategy for Aggregated Visual Query
Wei Chen, Yating Wei, Zhiyong Wang, Shuyue Zhou, Bingru Lin, Zhiguang Zhou
2020
View Paper
Federated Visualization: A Privacy-preserving Strategy for Decentralized Visualization
Wei Chen, Yating Wei, Zhiyong Wang, Shuyue Zhou, Bingru Lin, Zhiguang Zhou
2020
View Paper
SuPoolVisor: a visual analytics system for mining pool surveillance
Jia-zhi Xia, Yu-hong Zhang, Hui Ye, Ying Wang, Guangqi Jiang, Ying Zhao, Cong Xie, Xiao-yan Kui, Sheng-hui Liao, Wei-ping Wang
2020
View Paper
Rainbow: A Rendering-Aware Index for High-Quality Spatial Scatterplots with Result-Size Budgets
F. Sadlo, Qiushi Bai, Sadeem Alsudais, Chen Li, Shuang Zhao
2022
View Paper
Intelligent Data Visualization Analysis Techniques: A Survey
Yu-Yu Luo, Xue-Di Qin, Yu-Peng Xie, Guo-Liang Li
View Paper
A survey of urban visual analytics: domain problem, visualization, computation, and system
Zikun Deng, Di Weng, Shuhan Liu, Yuan Tian, Mingliang Xu, Yingcai Wu
View Paper

Comments (0)

This website uses cookies to ensure you get the best experience. Learn more