Publication
Metrics
AI Quick Summary
This study introduces the Rural Access Index (RAI) and the complementary "Not-served Rural Population" (NSRP) to assess global rural accessibility, finding significant disparities between developed and developing regions. It reveals a positive correlation between RAI and indicators of national development, suggesting that improved road infrastructure can enhance socio-economic conditions.
Paper Preview
Abstract
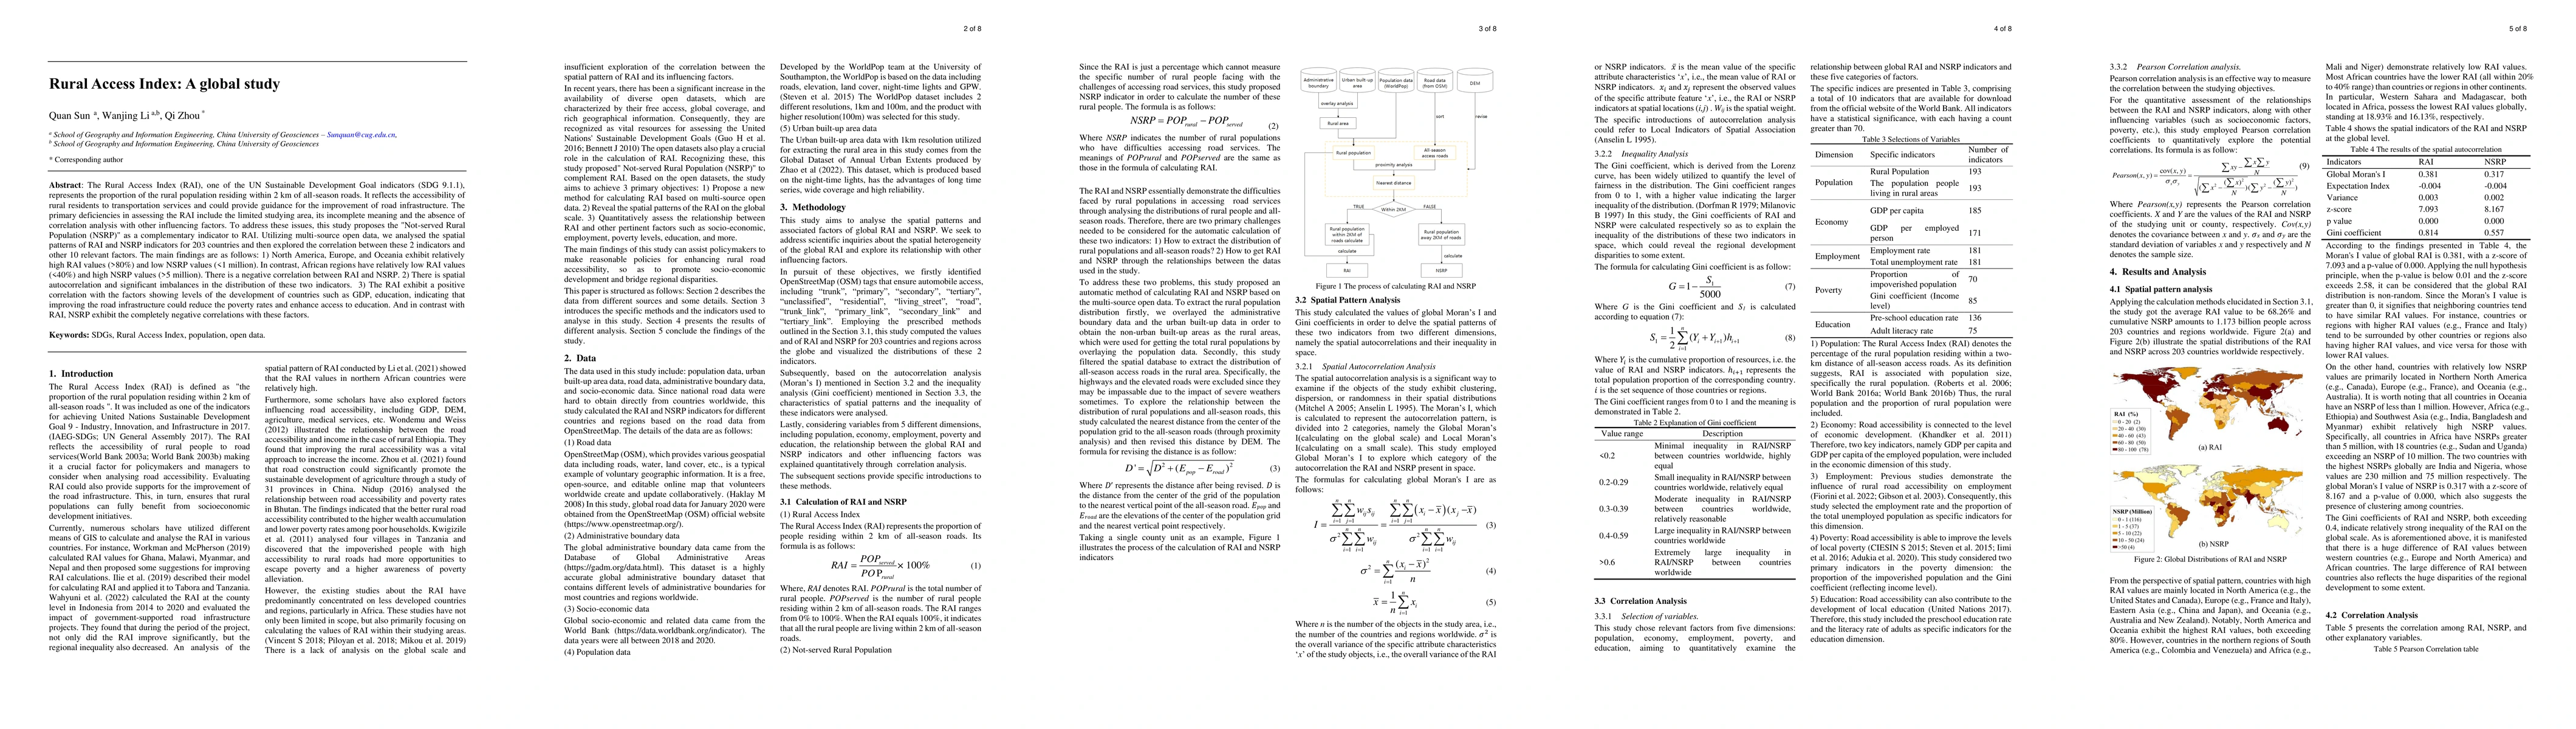
The Rural Access Index (RAI), one of the UN Sustainable Development Goal indicators (SDG 9.1.1), represents the proportion of the rural population residing within 2 km of all-season roads. It reflects the accessibility of rural residents to transportation services and could provide guidance for the improvement of road infrastructure. The primary deficiencies in assessing the RAI include the limited studying area, its incomplete meaning and the absence of correlation analysis with other influencing factors. To address these issues, this study proposes the "Not-served Rural Population (NSRP)" as a complementary indicator to RAI. Utilizing multi-source open data, we analysed the spatial patterns of RAI and NSRP indicators for 203 countries and then explored the correlation between these 2 indicators and other 10 relevant factors. The main findings are as follows: 1) North America, Europe, and Oceania exhibit relatively high RAI values (>80%) and low NSRP values (<1 million). In contrast, African regions have relatively low RAI values (<40%) and high NSRP values (>5 million). There is a negative correlation between RAI and NSRP. 2) There is spatial autocorrelation and significant imbalances in the distribution of these two indicators. 3) The RAI exhibit a positive correlation with the factors showing levels of the development of countries such as GDP, education, indicating that improving the road infrastructure could reduce the poverty rates and enhance access to education. And in contrast with RAI, NSRP exhibit the completely negative correlations with these factors.
AI Key Findings
Get AI-generated insights about this paper's methodology, results, significance, and more — seven facets brought into focus.
Impact
Paper Details
Authors
PDF Preview
Key Terms
Citation Network
Current paper (gray), citations (green), references (blue)
Display is limited for performance on very large graphs.
Discussion 0