Summary
Accurate subnational estimation of health indicators is critical for public health planning, especially in low- and middle-income countries (LMICs), where data and tools are often limited. The sae4health R shiny app, built on the surveyPrev package, provides a user-friendly tool for prevalence mapping using small area estimation (SAE) methods. Both area- and unit-level models with spatial random effects are available, with fast Bayesian inference performed using Integrated Nested Laplace Approximation (INLA). Currently, the app supports analysis of over 150 indicators from Demographic and Health Surveys (DHS) across multiple administrative levels. sae4health simplifies the use of complex prevalence mapping models to support data-driven decision-making. The app provides interactive visualization, summary, and report generation functionalities for a wide range of use cases. This paper outlines the app's statistical framework and demonstrates the workflow through a case study of child stunting in Nigeria. Additional documentation is available on the supporting website (https://sae4health.stat.uw.edu).
AI Key Findings
Generated May 28, 2025
Methodology
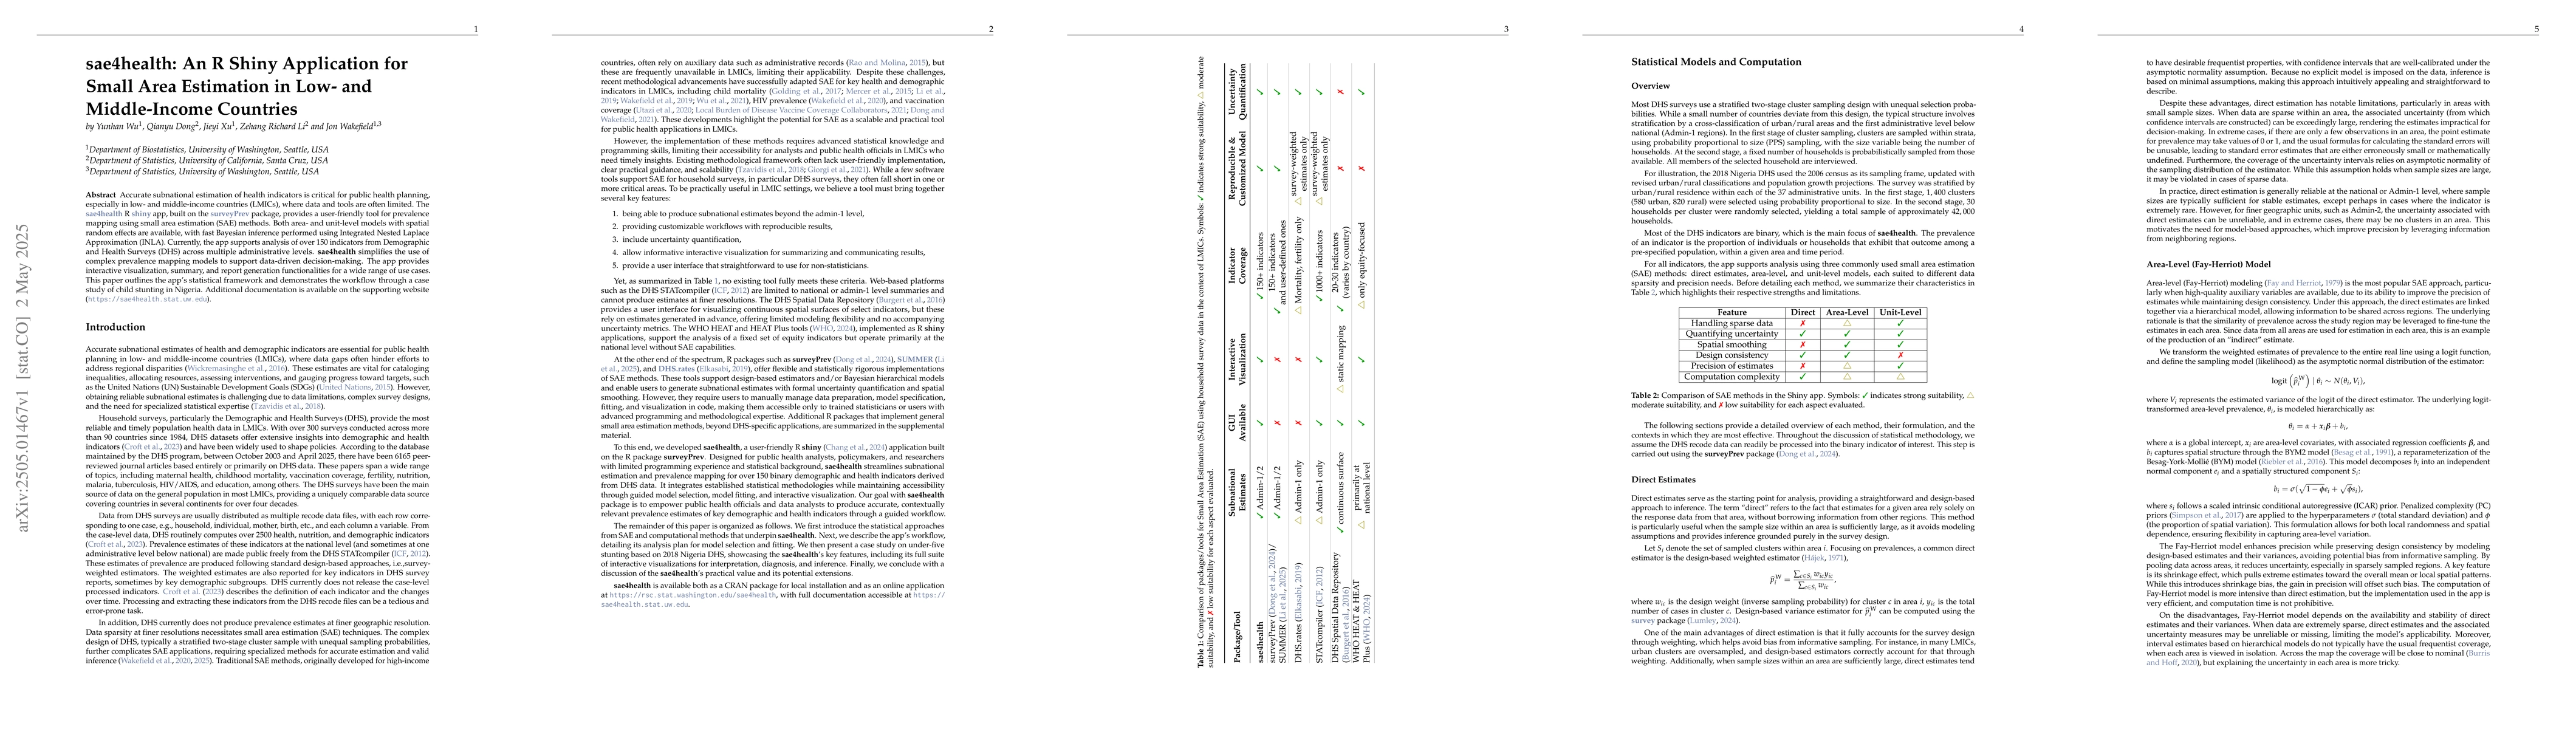
The sae4health R Shiny application employs small area estimation (SAE) methods using both area- and unit-level models with spatial random effects, facilitated by fast Bayesian inference via Integrated Nested Laplace Approximation (INLA). It supports analysis of over 150 health and demographic indicators from Demographic and Health Surveys (DHS) across multiple administrative levels.
Key Results
- The app simplifies the use of complex prevalence mapping models for data-driven decision-making in low- and middle-income countries (LMICs).
- It provides interactive visualization, summary, and report generation functionalities for a wide range of use cases, demonstrated through a case study of child stunting in Nigeria.
Significance
Accurate subnational estimation of health indicators is critical for public health planning, especially in LMICs where data and tools are often limited. The sae4health app democratizes access to statistically rigorous SAE analyses, enabling users to generate subnational estimates for various health and demographic indicators derived from DHS surveys under different models.
Technical Contribution
The sae4health R Shiny application builds on the surveyPrev package, offering a user-friendly tool for prevalence mapping with advanced features like nested models and covariate incorporation.
Novelty
The app's accessibility and unified interface eliminate many technical barriers, making sophisticated SAE methods available to users without programming or advanced statistical training, tailored for public health researchers and officials in low-resource settings.
Limitations
- The current implementation does not fully acknowledge survey design, which can lead to significant biases in prevalence estimates, primarily from urban-rural oversampling in DHS surveys.
- While the methodological framework can be readily adapted to Multiple Indicator Cluster Surveys (MICS) data, challenges arise from non-standardized indicator coding schemes and lack of harmonized data structures across countries.
Future Work
- Expanding the suite of model validation tools, including integration of MICS surveys into sae4health.
- Addressing systematic bias in unit-level models by fitting separate models for urban and rural data, and aggregating estimates using urban-rural population weights.
- Incorporating composite indicators such as under-five mortality rate (U5MR) and fertility rates, and exploring continuous spatial models for more precise geographic estimation.
Paper Details
PDF Preview
Citation Network
Current paper (gray), citations (green), references (blue)
Display is limited for performance on very large graphs.
Similar Papers
Found 4 papersSmall Area Estimation of Fertility in Low- and Middle-Income Countries
Jon Wakefield, Yunhan Wu
Small Area Estimation of Education Levels in Low- and Middle-Income Countries
Ameer Dharamshi, Jon Wakefield, Yunhan Wu
Modeling Urban/Rural Fractions in Low- and Middle-Income Countries
Jon Wakefield, Yunhan Wu
No citations found for this paper.
Comments (0)