SAERMA: Stacked Autoencoder Rule Mining Algorithm for the Interpretation of Epistatic Interactions in GWAS for Extreme Obesity
Publication
Metrics
AI Quick Summary
Researchers developed SAERMA, a method combining autoencoders and rule mining to identify epistatic interactions in genome-wide association studies for extreme obesity, achieving 77% accuracy with 100 units.
Paper Preview
Abstract
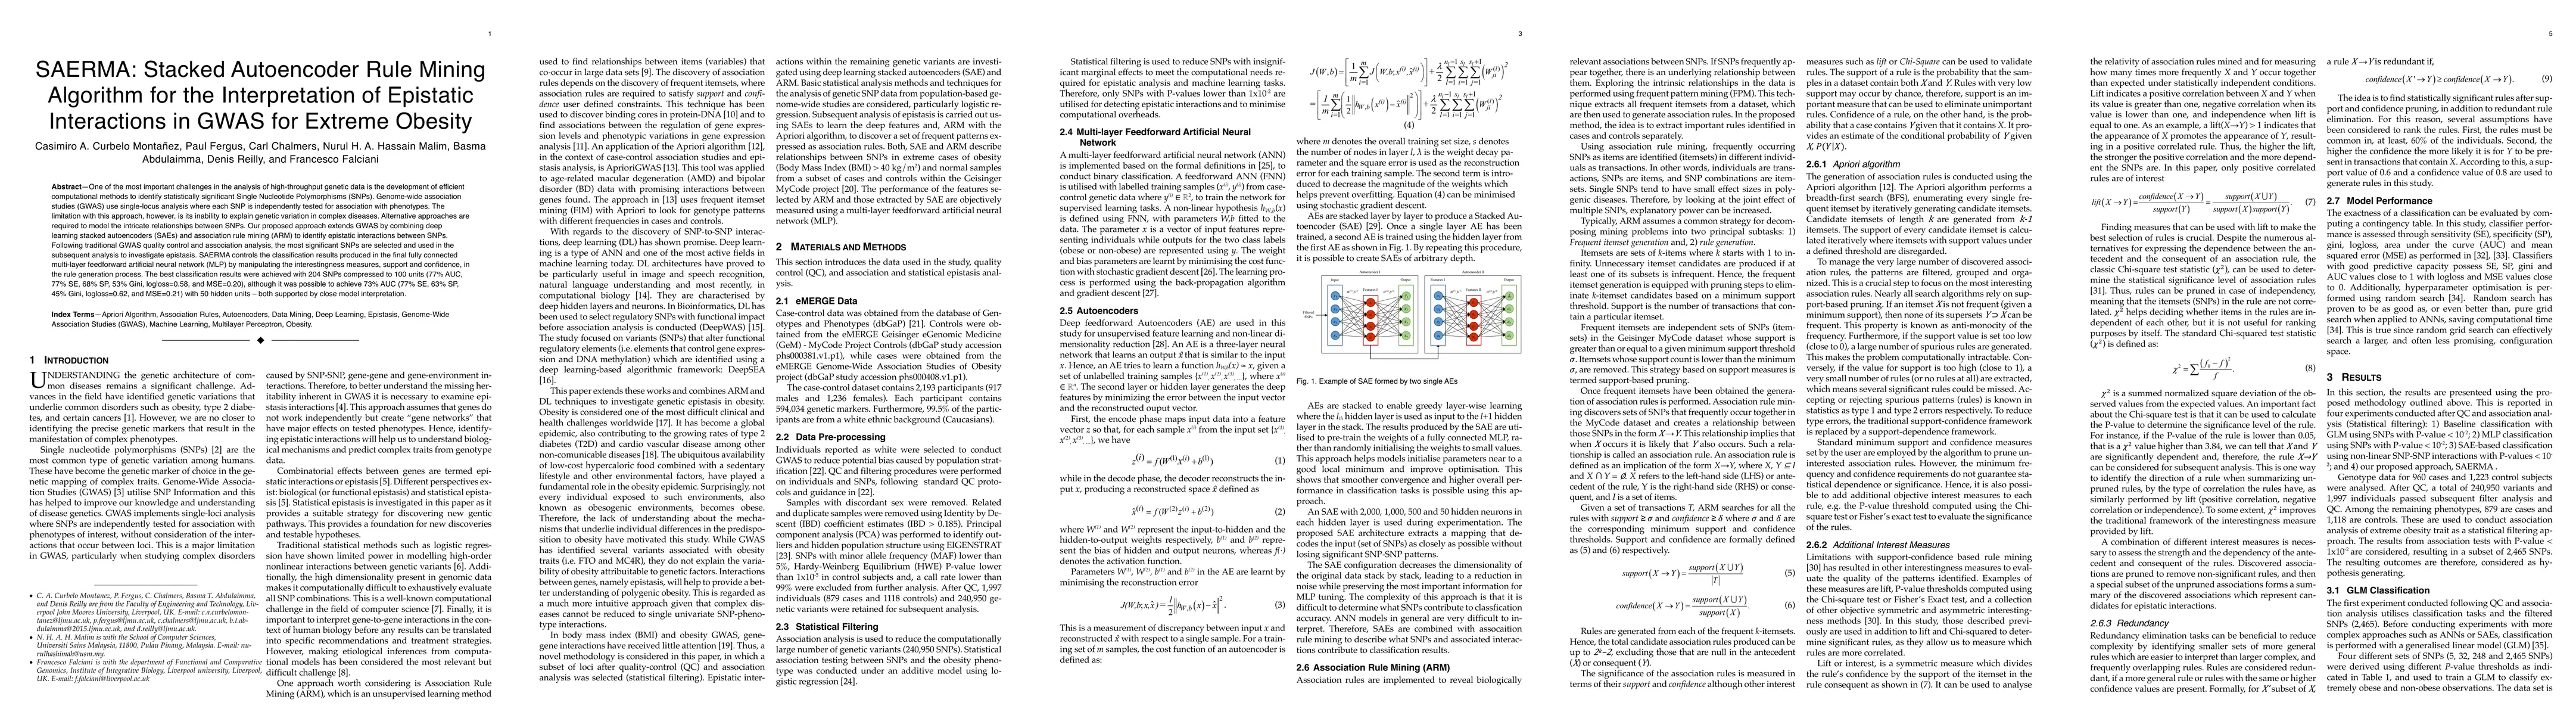
One of the most important challenges in the analysis of high-throughput genetic data is the development of efficient computational methods to identify statistically significant Single Nucleotide Polymorphisms (SNPs). Genome-wide association studies (GWAS) use single-locus analysis where each SNP is independently tested for association with phenotypes. The limitation with this approach, however, is its inability to explain genetic variation in complex diseases. Alternative approaches are required to model the intricate relationships between SNPs. Our proposed approach extends GWAS by combining deep learning stacked autoencoders (SAEs) and association rule mining (ARM) to identify epistatic interactions between SNPs. Following traditional GWAS quality control and association analysis, the most significant SNPs are selected and used in the subsequent analysis to investigate epistasis. SAERMA controls the classification results produced in the final fully connected multi-layer feedforward artificial neural network (MLP) by manipulating the interestingness measures, support and confidence, in the rule generation process. The best classification results were achieved with 204 SNPs compressed to 100 units (77% AUC, 77% SE, 68% SP, 53% Gini, logloss=0.58, and MSE=0.20), although it was possible to achieve 73% AUC (77% SE, 63% SP, 45% Gini, logloss=0.62, and MSE=0.21) with 50 hidden units - both supported by close model interpretation.
AI Key Findings
Get AI-generated insights about this paper's methodology, results, significance, and more — seven facets brought into focus.
Impact
Paper Details
Authors
PDF Preview
Key Terms
Citation Network
Current paper (gray), citations (green), references (blue)
Display is limited for performance on very large graphs.
Discussion 0