Publication
Metrics
AI Quick Summary
This paper investigates MLB game streaks from 1901 to 2019 to determine the likelihood of same-score streaks of lengths 2, 3, and 4, using probability models to simulate and analyze the distribution of runs scored.
Paper Preview
Abstract
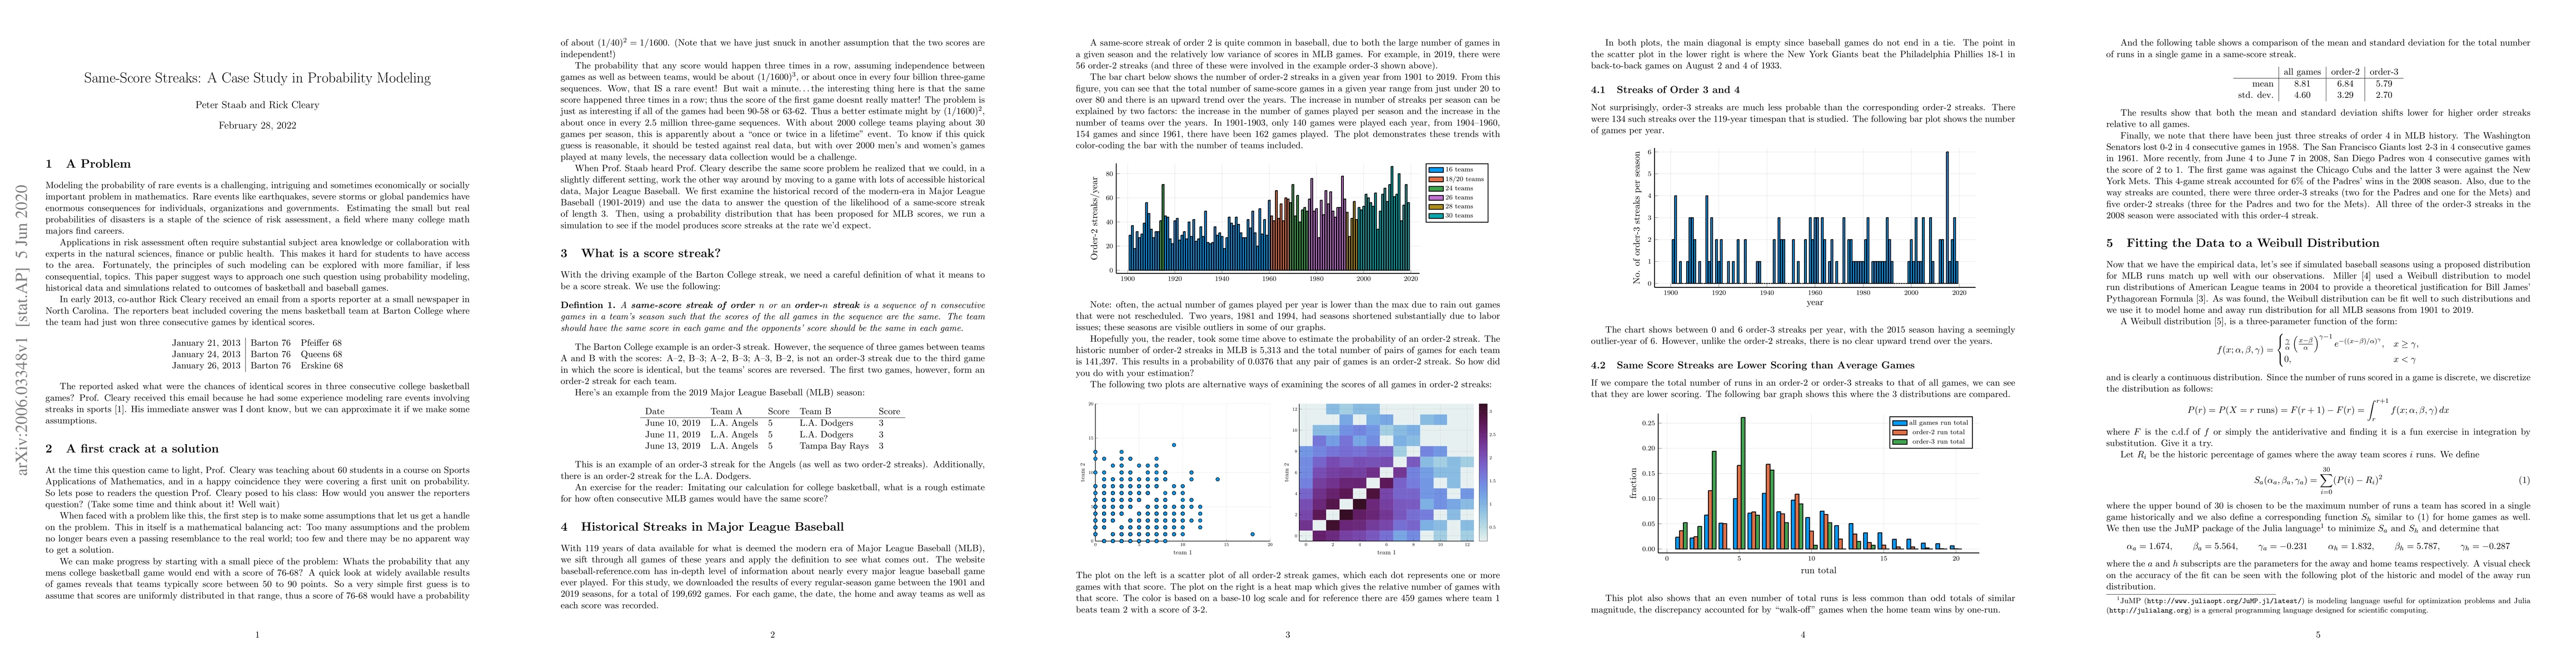
A same-score streak in sports is a sequence of games where the scores are equivalent in all games. The motivating problem arose from college basketball, however due to the difficulty in collecting data, streaks in Major League Baseball (MLB) were studied instead. This paper explores the historic data from regular-season games between 1901 and 2019 to include the likelihood of streaks of length 2, 3 and 4. Then we explore various probability models for the distribution of runs scored during MLB games and seasons and generate simulated statistics for the same length of streaks.
AI Key Findings
Get AI-generated insights about this paper's methodology, results, significance, and more — seven facets brought into focus.
Impact
Paper Details
Authors
PDF Preview
Key Terms
Citation Network
Current paper (gray), citations (green), references (blue)
Display is limited for performance on very large graphs.
Discussion 0