Summary
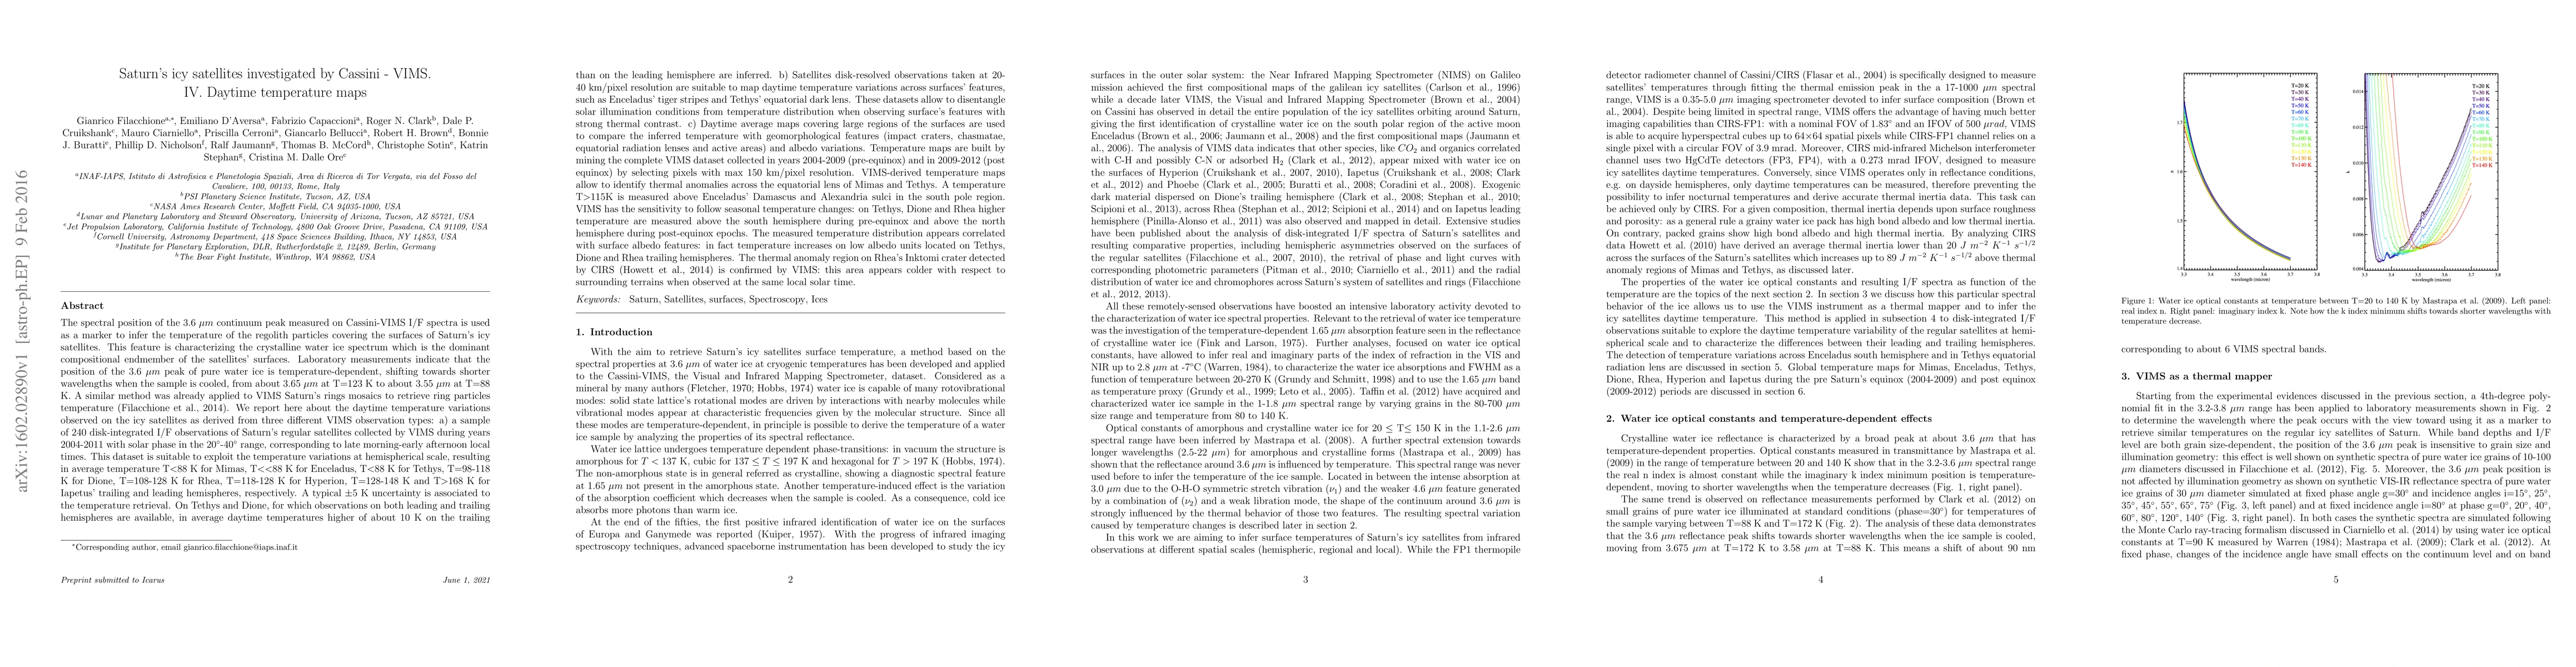
The spectral position of the 3.6 micron continuum peak measured on Cassini-VIMS I/F spectra is used as a marker to infer the temperature of the regolith particles covering the surfaces of Saturn's icy satellites. This feature is characterizing the crystalline water ice spectrum which is the dominant compositional endmember of the satellites' surfaces. Laboratory measurements indicate that the position of the 3.6 micron peak of pure water ice is temperature-dependent, shifting towards shorter wavelengths when the sample is cooled, from about 3.65 micron at T=123 K to about 3.55 micron at T=88 K. A similar method was already applied to VIMS Saturn's rings mosaics to retrieve ring particles temperature (Filacchione et al., 2014). We report here about the daytime temperature variations observed on the icy satellites as derived from three different VIMS observation types. Temperature maps are built by mining the complete VIMS dataset collected in years 2004-2009 (pre-equinox) and in 2009-2012 (post equinox) by selecting pixels with max 150 km/pixel resolution. VIMS-derived temperature maps allow to identify thermal anomalies across the equatorial lens of Mimas and Tethys.
AI Key Findings
Get AI-generated insights about this paper's methodology, results, and significance.
Paper Details
PDF Preview
Key Terms
Citation Network
Current paper (gray), citations (green), references (blue)
Display is limited for performance on very large graphs.
Similar Papers
Found 4 papersSaturn's icy satellites investigated by Cassini -- VIMS. V. Spectrophotometry
C. Plainaki, M. Ciarniello, K. Stephan et al.
| Title | Authors | Year | Actions |
|---|
Comments (0)