Scalable Topological Data Analysis and Visualization for Evaluating Data-Driven Models in Scientific Applications
Publication
Metrics
AI Quick Summary
This paper introduces a scalable topological data analysis (TDA) and visualization method for evaluating data-driven models, addressing the challenges of interpreting black box models and handling large datasets. The proposed solution combines streaming neighborhood graphs, topology computation, and topology aware datacubes for interactive exploration, demonstrated through insights in high-energy-density physics and computational biology.
Paper Preview
Abstract
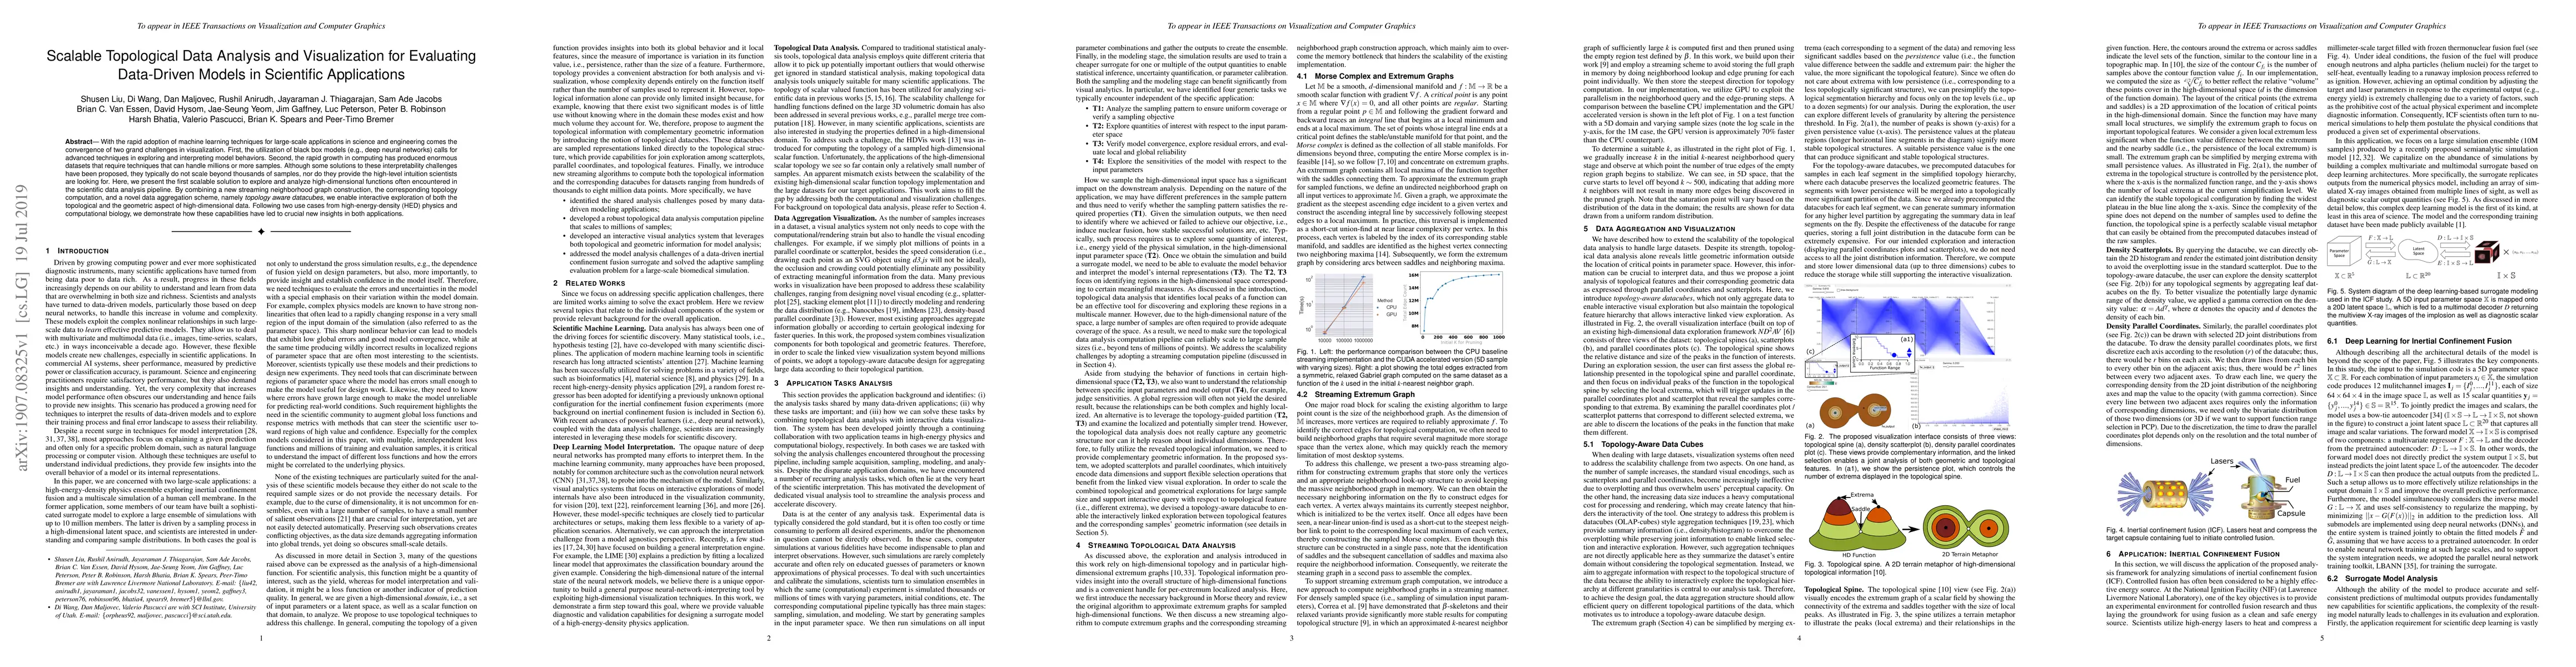
With the rapid adoption of machine learning techniques for large-scale applications in science and engineering comes the convergence of two grand challenges in visualization. First, the utilization of black box models (e.g., deep neural networks) calls for advanced techniques in exploring and interpreting model behaviors. Second, the rapid growth in computing has produced enormous datasets that require techniques that can handle millions or more samples. Although some solutions to these interpretability challenges have been proposed, they typically do not scale beyond thousands of samples, nor do they provide the high-level intuition scientists are looking for. Here, we present the first scalable solution to explore and analyze high-dimensional functions often encountered in the scientific data analysis pipeline. By combining a new streaming neighborhood graph construction, the corresponding topology computation, and a novel data aggregation scheme, namely topology aware datacubes, we enable interactive exploration of both the topological and the geometric aspect of high-dimensional data. Following two use cases from high-energy-density (HED) physics and computational biology, we demonstrate how these capabilities have led to crucial new insights in both applications.
AI Key Findings
Get AI-generated insights about this paper's methodology, results, significance, and more — seven facets brought into focus.
Impact
Paper Details
PDF Preview
Key Terms
Citation Network
Current paper (gray), citations (green), references (blue)
Display is limited for performance on very large graphs.
Discussion 0