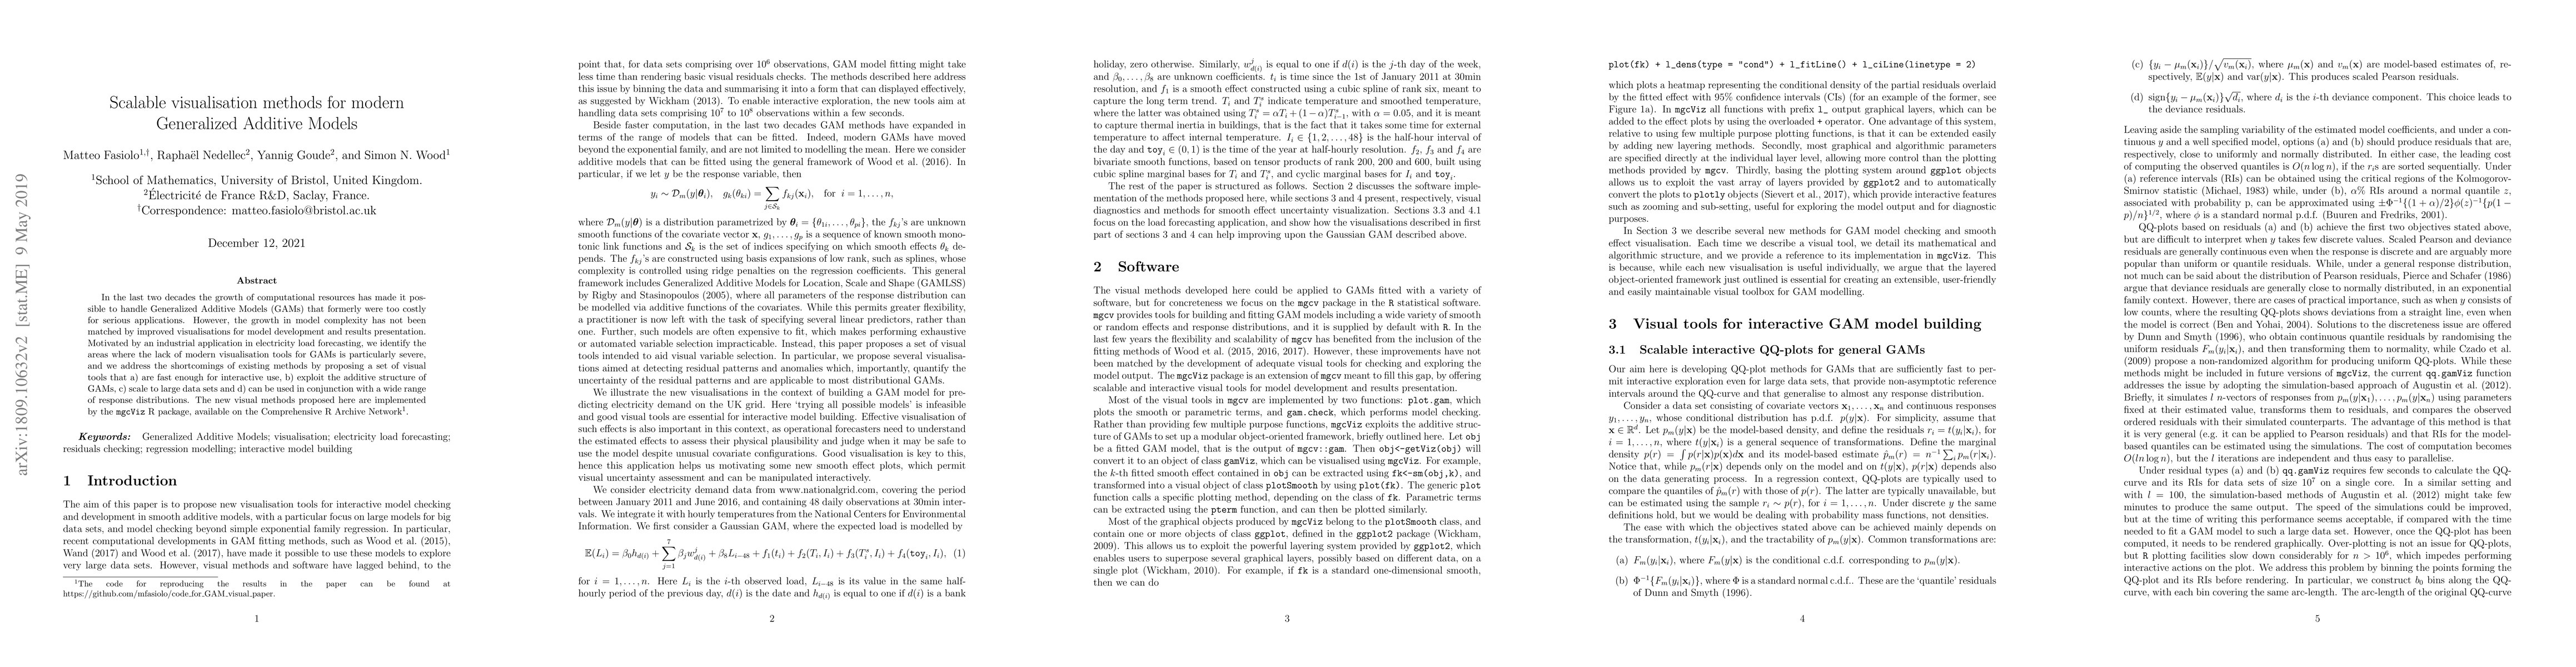
Scalable visualisation methods for modern Generalized Additive Models
Publication
Metrics
Paper Preview
Abstract
In the last two decades the growth of computational resources has made it possible to handle Generalized Additive Models (GAMs) that formerly were too costly for serious applications. However, the growth in model complexity has not been matched by improved visualisations for model development and results presentation. Motivated by an industrial application in electricity load forecasting, we identify the areas where the lack of modern visualisation tools for GAMs is particularly severe, and we address the shortcomings of existing methods by proposing a set of visual tools that a) are fast enough for interactive use, b) exploit the additive structure of GAMs, c) scale to large data sets and d) can be used in conjunction with a wide range of response distributions. All the new visual methods proposed in this work are implemented by the mgcViz R package, which can be found on the Comprehensive R Archive Network.
AI Key Findings
Get AI-generated insights about this paper's methodology, results, significance, and more — seven facets brought into focus.
Impact
Paper Details
PDF Preview
Key Terms
Citation Network
Current paper (gray), citations (green), references (blue)
Display is limited for performance on very large graphs.
Discussion 0