ScaleTrotter offers an interactive visualization framework for genome data, enabling smooth transitions across multiple scales from cellular nuclei to DNA atomistic structures. It addresses unique challenges in genome visualization, such as the interconnectedness of scale levels and the need to embed smaller scales into larger ones, using a scale-dependent camera model and integrated 2D/3D representations.
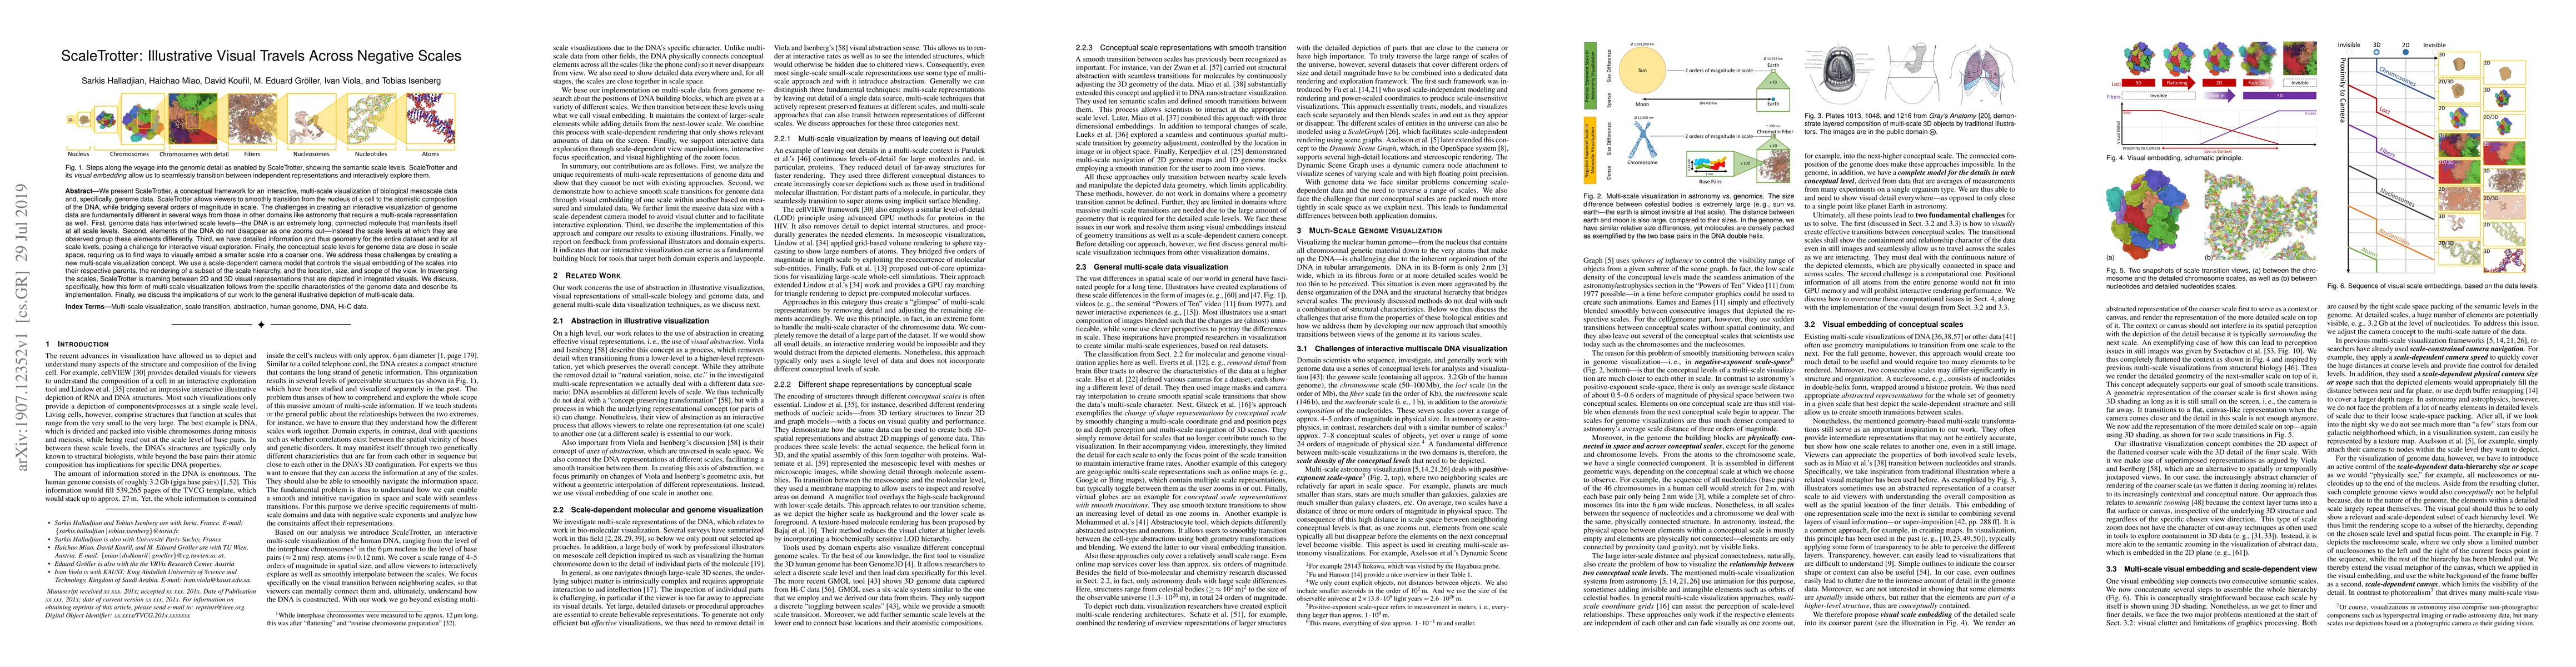
We present ScaleTrotter, a conceptual framework for an interactive, multi-scale visualization of biological mesoscale data and, specifically, genome data. ScaleTrotter allows viewers to smoothly transition from the nucleus of a cell to the atomistic composition of the DNA, while bridging several orders of magnitude in scale. The challenges in creating an interactive visualization of genome data are fundamentally different in several ways from those in other domains like astronomy that require a multi-scale representation as well. First, genome data has intertwined scale levels---the DNA is an extremely long, connected molecule that manifests itself at all scale levels. Second, elements of the DNA do not disappear as one zooms out---instead the scale levels at which they are observed group these elements differently. Third, we have detailed information and thus geometry for the entire dataset and for all scale levels, posing a challenge for interactive visual exploration. Finally, the conceptual scale levels for genome data are close in scale space, requiring us to find ways to visually embed a smaller scale into a coarser one. We address these challenges by creating a new multi-scale visualization concept. We use a scale-dependent camera model that controls the visual embedding of the scales into their respective parents, the rendering of a subset of the scale hierarchy, and the location, size, and scope of the view. In traversing the scales, ScaleTrotter is roaming between 2D and 3D visual representations that are depicted in integrated visuals. We discuss, specifically, how this form of multi-scale visualization follows from the specific characteristics of the genome data and describe its implementation. Finally, we discuss the implications of our work to the general illustrative depiction of multi-scale data.
Get AI-generated insights about this paper's methodology, results, and significance.
Current paper (gray), citations (green), references (blue)
No similar papers found for this research.
Title | Authors | Year | Actions |
---|---|---|---|
Learning Image Fractals Using Chaotic Differentiable Point Splatting
|
Adarsh Djeacoumar, Felix Mujkanovic, Hans-Peter Seidel, Thomas Leimkühler
|
2025
|
View Paper |
Visual narratives to edutain against misleading visualizations in healthcare
|
Anna Shilo, R. Raidou
|
2024
|
View Paper |
Learning Images Across Scales Using Adversarial Training
|
Krzysztof Wolski, Adarsh Djeacoumar, Alireza Javanmardi, Hans-Peter Seidel, C. Theobalt, Guillaume Cordonnier, K. Myszkowski, G. Drettakis, Xingang Pan, Thomas Leimkühler
|
2024
|
View Paper |
A Design Space for Visualization with Large Scale-Item Ratios
|
Mara Solen, Tamara Munzner
|
2024
|
View Paper |
Multi-Focus Querying of the Human Genome Information on Desktop and in Virtual Reality: an Evaluation
|
Gunnar W. Reiske, S. In, Yalong Yang
|
2023
|
View Paper |
Moliverse: Contextually embedding the microcosm into the universe
|
Mathis Brossier, Robin Skånberg, Lonni Besançon, M. Linares, Tobias Isenberg, Anders Ynnerman, A. Bock
|
2023
|
View Paper |
State of the Art of Molecular Visualization in Immersive Virtual Environments
|
David Kuťák, Pere-Pau Vázquez, Tobias Isenberg, M. Krone, M. Baaden, J. Byška, B. Kozlíková, H. Miao
|
2023
|
View Paper |
LineageD: An Interactive Visual System for Plant Cell Lineage Assignments based on Correctable Machine Learning
|
Jia-Shun Hong, A. Trubuil, Tobias Isenberg
|
2022
|
View Paper |
A Survey of Visualization Approaches for Comparative Genomics
|
Min Zhu, Lin Yao, Xiangkun Wang, Mingyang Zhang, Xinyi Wang, Zhaohui Liang
|
2022
|
View Paper |
Multiscale Visualization: A Structured Literature Analysis
|
E. Cakmak, Dominik Jäckle, Tobias Schreck, D. Keim, Johannes Fuchs
|
2021
|
View Paper |
Vivern–A Virtual Environment for Multiscale Visualization and Modeling of DNA Nanostructures
|
David Kuťák, M. Selzer, J. Byška, M. L. Ganuza, I. Barišić, B. Kozlíková, H. Miao
|
2021
|
View Paper |
Multiscale Unfolding: Illustratively Visualizing the Whole Genome at a Glance
|
Sarkis Halladjian, David Kouril, H. Miao, Eduard Gröller, I. Viola, Tobias Isenberg
|
2021
|
View Paper |
Modeling in the Time of COVID-19: Statistical and Rule-based Mesoscale Models
|
N. Nguyen Nguyen, Ondřej Ondrej Strnad Strnad, Tobias Tobias Klein Klein, Deng Deng Luo Luo, Ruwayda Ruwayda Alharbi Alharbi, Peter Peter Wonka Wonka, Martina Martina Maritan Maritan, Peter Peter Mindek Mindek, Ludovic Ludovic Autin Autin, David S. David S. Goodsell Goodsell, Ivan Ivan Viola Viola
|
2020
|
View Paper |
Modeling in the Time of COVID-19: Statistical and Rule-based Mesoscale Models
|
Ngan Nguyen, Ondřej Strnad, T. Klein, Deng Luo, Ruwayda Alharbi, Peter Wonka, M. Maritan, P. Mindek, L. Autin, D. Goodsell, I. Viola
|
2020
|
View Paper |
HyperLabels: Browsing of Dense and Hierarchical Molecular 3D Models
|
David Kouril, Tobias Isenberg, B. Kozlíková, Miriah D. Meyer, Eduard Gröller, I. Viola
|
2020
|
View Paper |
Multi-Focus Querying of the Human Genome using Virtual Reality and Desktop
|
Gunnar W. Reiske
|
2023
|
View Paper |
2D Graphical Representation of DNA Sequences Based on Variant Map
|
Ruoxue Wu, Wenjia Liu, Yuyuan Mao, Jeffrey Zheng
|
2020
|
View Paper |
Geometric Abstraction for Effective Visualization and Modeling
|
H. Miao
|
2019
|
View Paper |
Comments (0)