Publication
Metrics
AI Quick Summary
This paper proposes a scaling-aware rating system for evaluating count forecasts, especially in retail, to mitigate the bias caused by precision scaling and to distinguish between unavoidable noise and poor forecast quality. The method involves stratifying predictions into value buckets and comparing achieved metrics against benchmarks to obtain a single, interpretable rating for different products.
Paper Preview
Abstract
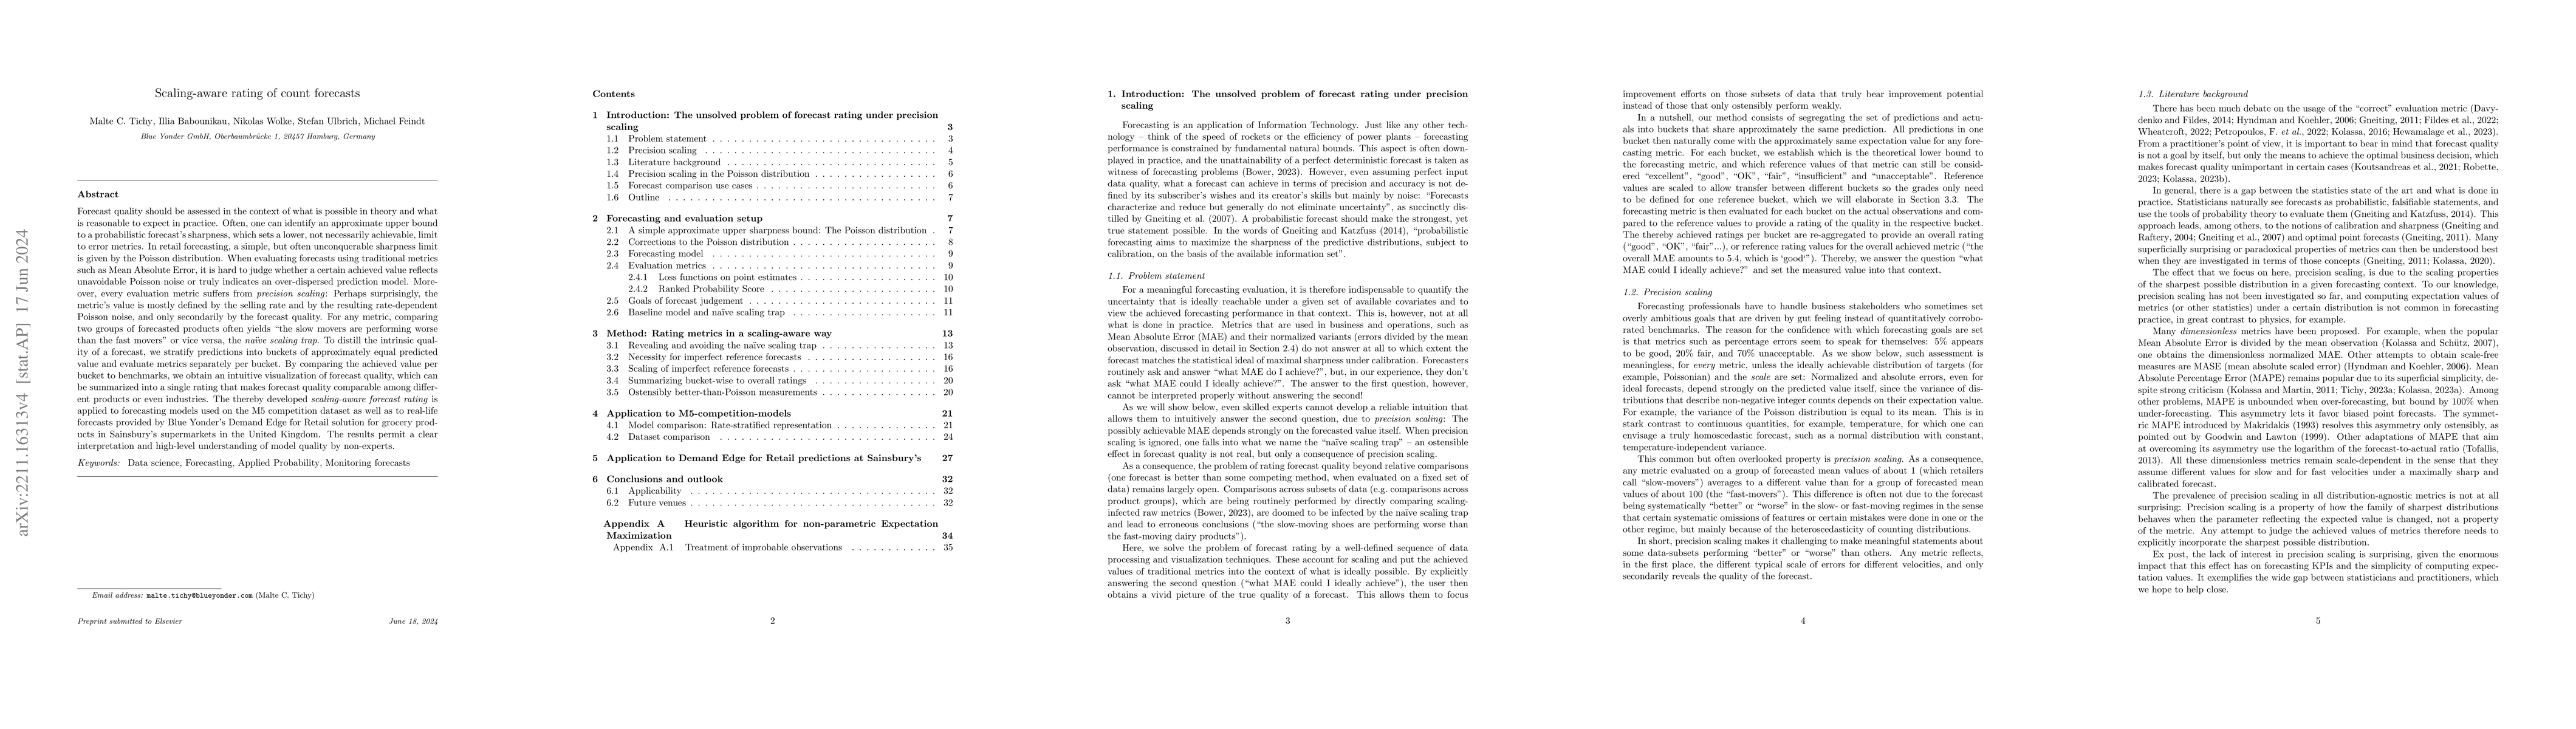
Forecast quality should be assessed in the context of what is possible in theory and what is reasonable to expect in practice. Often, one can identify an approximate upper bound to a probabilistic forecast's sharpness, which sets a lower, not necessarily achievable, limit to error metrics. In retail forecasting, a simple, but often unconquerable sharpness limit is given by the Poisson distribution. When evaluating forecasts using traditional metrics such as Mean Absolute Error, it is hard to judge whether a certain achieved value reflects unavoidable Poisson noise or truly indicates an overdispersed prediction model. Moreover, every evaluation metric suffers from precision scaling: Perhaps surprisingly, the metric's value is mostly defined by the selling rate and by the resulting rate-dependent Poisson noise, and only secondarily by the forecast quality. For any metric, comparing two groups of forecasted products often yields "the slow movers are performing worse than the fast movers" or vice versa, the na\"ive scaling trap. To distill the intrinsic quality of a forecast, we stratify predictions into buckets of approximately equal predicted value and evaluate metrics separately per bucket. By comparing the achieved value per bucket to benchmarks, we obtain an intuitive visualization of forecast quality, which can be summarized into a single rating that makes forecast quality comparable among different products or even industries. The thereby developed scaling-aware forecast rating is applied to forecasting models used on the M5 competition dataset as well as to real-life forecasts provided by Blue Yonder's Demand Edge for Retail solution for grocery products in Sainsbury's supermarkets in the United Kingdom. The results permit a clear interpretation and high-level understanding of model quality by non-experts.
AI Key Findings
Get AI-generated insights about this paper's methodology, results, significance, and more — seven facets brought into focus.
Impact
Paper Details
Authors
PDF Preview
Key Terms
Citation Network
Current paper (gray), citations (green), references (blue)
Display is limited for performance on very large graphs.
Discussion 0